


 Alıntı yaparak yanıtla
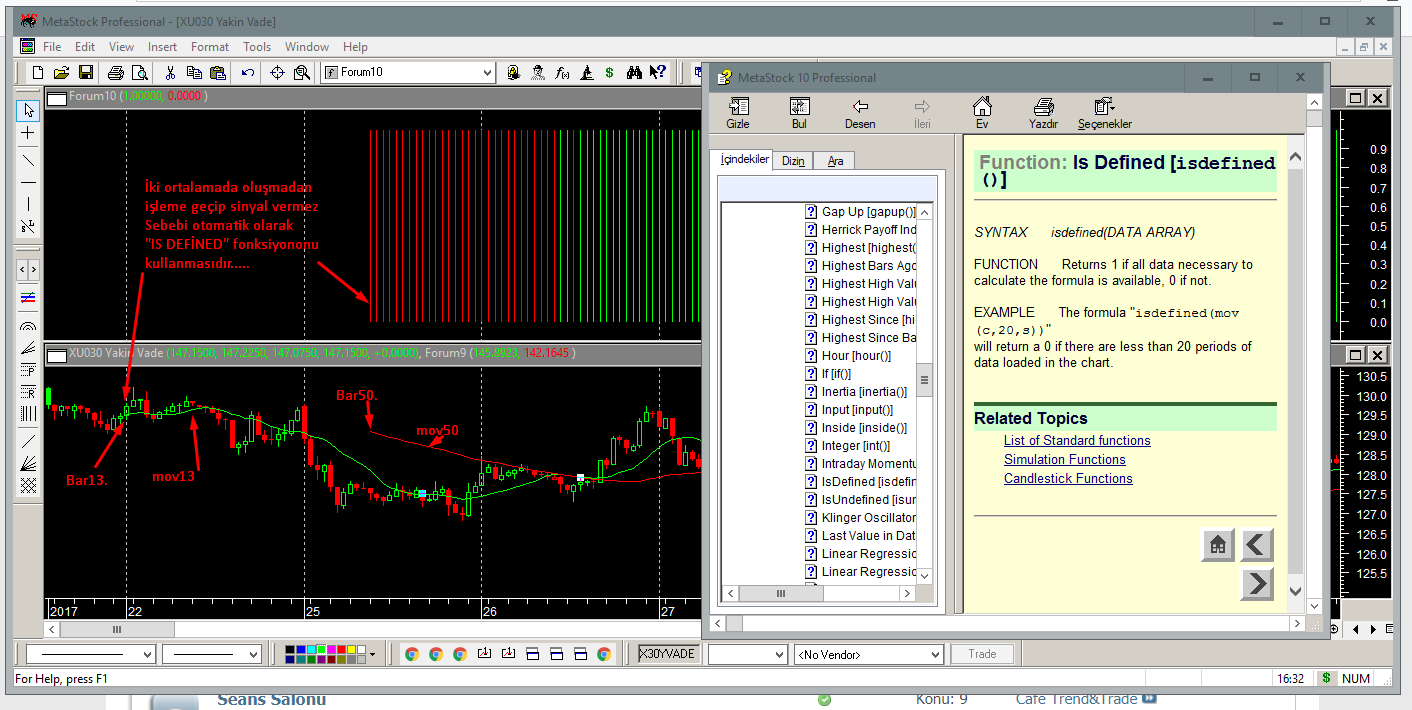
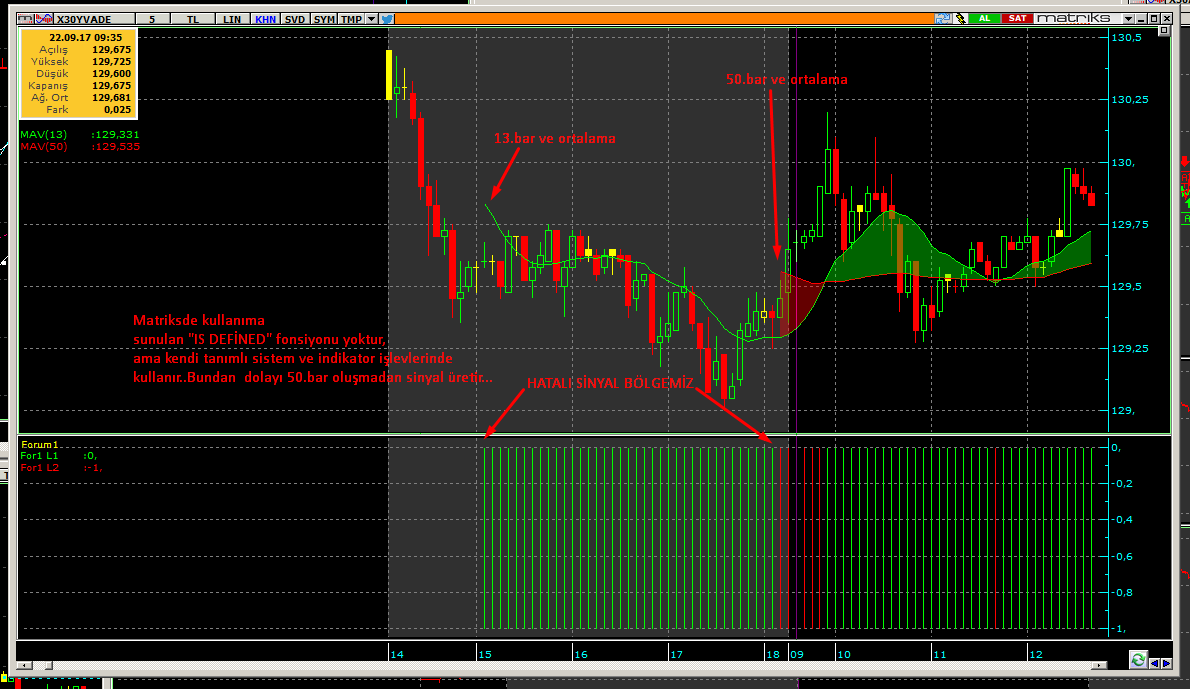
sayın uufuk ema için linkteki dökümanda sizinkinden biraz farklı bir yaklaşım var, aradığınıza çözüm olabilir mi diye paylaşıyorum.Originally Posted by uufuk

Step 2: The Logic
Start with the initial values that will not change. The time interval is fixed but assigned to a variable. Alpha is also fixed but still needs to be calculated:
tp:= 40; {EMA time periods}
alpha:= 2 / (tp +1);
Next, the formula to identify the start of a new time period should be done. This is best near the top so it is easily changed allowing the basic logic of a formula to be reused with just minor 78changes. The formula for an hourly extrapolation will look for
a change in the value of the Hour() function. Since the 5 minute interval is where the formula will be applied and 5 minutes is evenly divisible into 60 minutes, this extrapolation is possible. The same logic for a daily extrapolation can be used. Just change the DayOfWeek() function to the Hour() function:
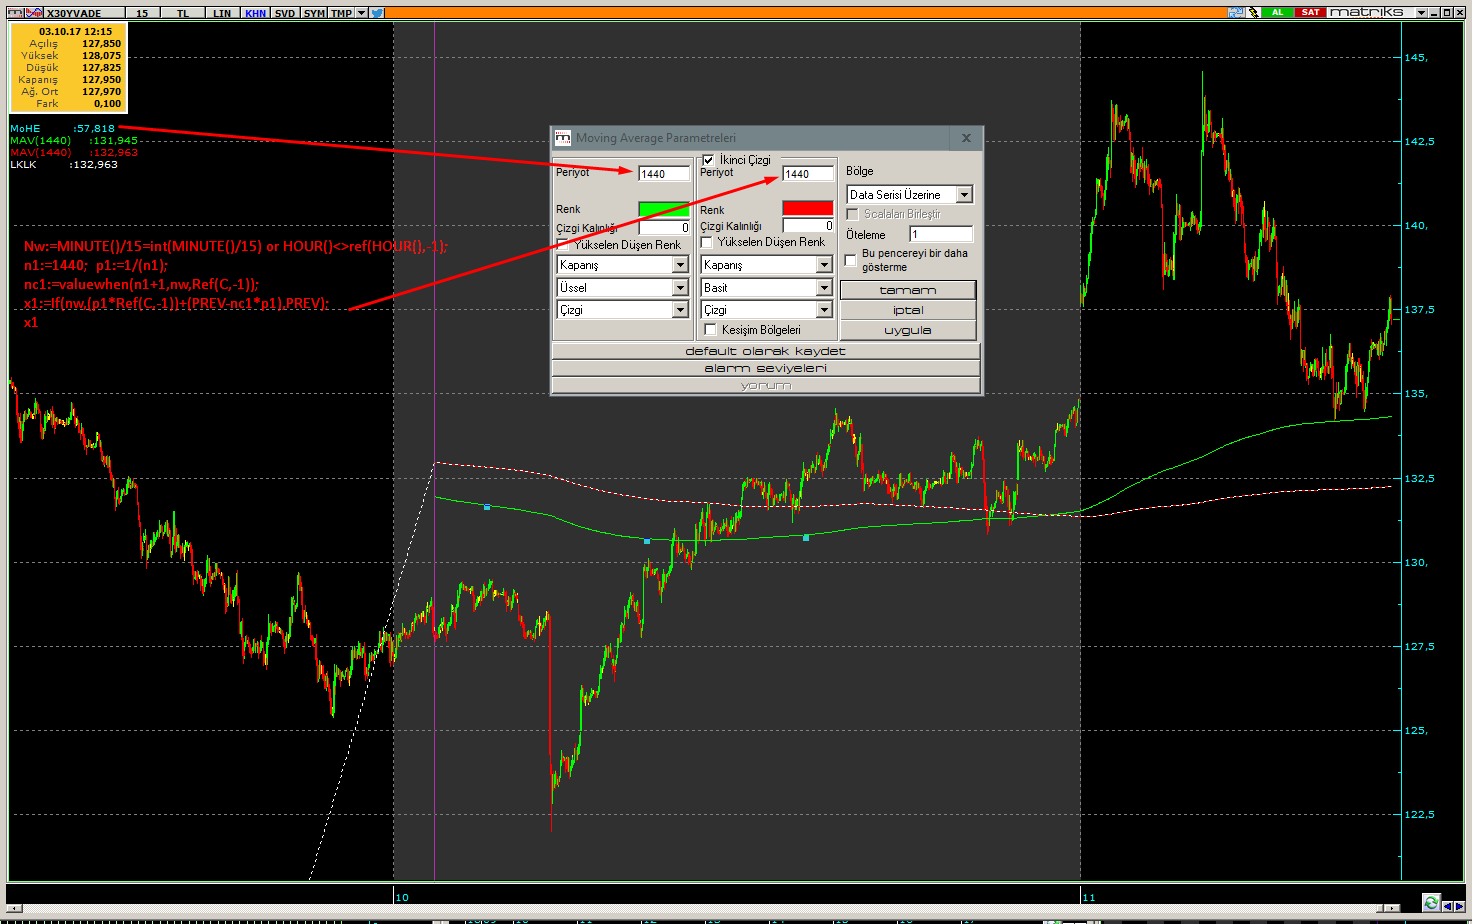
new:=ROC(Hour(),1,$)<>0;
This identifies when a new hour starts. However, the average needs to use the Close of the previous hour for the calculation. So, each time new is true, the Ref() function is used to get the previous barâs close for the new value in the average. If new is not
true, use PREV to ârememberâ the last value of the average. This same PREV is used for the value of the average from the previous interval to calculate the next of the average:
EMA:= If( new, ( Ref(C, -1) * alpha) + ( PREV * (1-alpha)), PREV);
However, this calculation does not seed the average with the close of the first hour in the chart. PREV has the value of zero at the start of the chart. This means the value of EMA will start at zero and slowly increase over the next several hours before it
gets to a value close to what the prices are. Typically, this would take one to two times the length of the average. To avoid that, the average can be assigned a value to start with. This seed value will then be used by PREV as a jump-start, instead of the value of zero.To seed the average, another If() must be combined with the first. When new is true, this If() is checked first and can only be true on the first hour of the chart. The Cum() function can be used to count the number of times new has been TRUE:
EMA:= If
( new, If( Cum( new ) = 1, Ref(C, -1),
( Ref(C, -1) * alpha) + ( PREV * (1-alpha))), PREV);
Step 3: The Final FormulaNow all that remains is to call the EMA variable so the formula will plot the value. The final formula should look something like this:
tp:= 40; {EMA time periods}
new:=ROC(Hour(),1,$)<>0;
alpha:= 2 / (tp +1);
EMA:=
If
( new, If( Cum( new ) = 1, Ref(C, -1),
( Ref(C, -1) * alpha) + ( PREV * (1-alpha)), PREV));
EMA
bu ilgili dökümanın linki sayfa 80
https://www.metastock.com/customer/r..._Primer_II.pdf
matriks için denemedim çalışır mı fikrim yoktur. saygılar


Yer İmleri