MUSLUCA İndikatörünü Pine Editör e kaydedin..
PHP Code:
//@version=5
indicator('MUSLUCA-4S', shorttitle='MUSLUCA-4S', overlay=true, max_bars_back=4000)
/////////////////////GRAFÄ°K
// EMA-14
ma8_len = input(8, "Length", group='EMA')
src8 = input(close, "Source")
res8 = input.timeframe('240', "Resolution", title="EMA-8 4S")
htf_ma8 = ta.ema(src8, ma8_len)
out8 = request.security(syminfo.tickerid, res8, htf_ma8)
plot(out8, color=color.rgb(15, 186, 3), linewidth=2, title='EMA8 4S')
ma18_len = input(55, "Length", group='EMA')
src18 = input(close, "Source")
res18 = input.timeframe('240', "Resolution", title="EMA55 4S")
htf_ma18 = ta.ema(src18, ma18_len)
out18 = request.security(syminfo.tickerid, res18, htf_ma18)
plot(out18, color=color.rgb(241, 6, 6), linewidth=2, style=plot.style_cross, title='EMA55 4S')
ma28_len = input(8, "Length", group='EMA')
src28 = input(close, "Source")
res28 = input.timeframe('1D', "Resolution", title="EMA8 GÃNLÃK")
htf_ma28 = ta.ema(src28, ma28_len)
out28 = request.security(syminfo.tickerid, res28, htf_ma28)
plot(out28, color=color.rgb(228, 1, 134), linewidth=2, title='EMA8 GÃNLÃK')
/////////////////////
ma3_len = input(9, "Length", group='WMA')
src3 = input(close, "Source")
res3 = input.timeframe('1W', "Resolution", title="wma9Periyod")
htf_ma3 = ta.wma(src3, ma3_len)
out3 = request.security(syminfo.tickerid, res3, htf_ma3)
plot(out3, color=color.rgb(10, 147, 0), linewidth=3, title='WMA-9HAFTALIK')
ma4_len = input.int(15, "Length", group='WMA')
src4 = input(close, "Source")
res4 = input.timeframe('1W', "Resolution", title="wma15Periyod")
htf_ma4 = ta.wma(src4, ma4_len)
out4 = request.security(syminfo.tickerid, res4, htf_ma4)
plot(out4, color=color.rgb(255, 136, 0), linewidth=3, title='WMA-15HAFTALIK')
// Haftalık 9 EMA'nın %15 fazlasını hesapla
percent_increase = input.int(15, title="Percent Increase") / 100
// ATR'yi kullanmadan %15 artıÅı hesapla
trailing_percent = 1 + percent_increase
trailing_value = out3 * trailing_percent
// Plot the trailing line
plot(trailing_value, color=color.rgb(0, 4, 7), linewidth=2, style=plot.style_cross, title='Trailing %15')
// Haftalık 9 WMA'nın %30 fazlasını hesapla
percent_increase1 = input.int(30, title="Percent Increase") / 100
// ATR'yi kullanmadan %30 artıÅı hesapla
trailing_percent1 = 1 + percent_increase1
trailing_value1 = out3 * trailing_percent1
// Plot the trailing line
plot(trailing_value1, color=color.rgb(255, 0, 0), linewidth=1, title='Trailing %30')
/////
// Haftalık 9 WMA'nın %40 fazlasını hesapla
percent_increase2 = input.int(40, title="Percent Increase") / 100
// ATR'yi kullanmadan %40 artıÅı hesapla
trailing_percent2 = 1 + percent_increase2
trailing_value2 = out3 * trailing_percent2
// Plot the trailing line
plot(trailing_value2, color=color.rgb(255, 136, 0), linewidth=1, title='Trailing %40')
///////
// Haftalık 9 WMA'nın %50 fazlasını hesapla
percent_increase3 = input.int(50, title="Percent Increase") / 100
// ATR'yi kullanmadan %60 artıÅı hesapla
trailing_percent3 = 1 + percent_increase3
trailing_value3 = out3 * trailing_percent3
// Plot the trailing line
plot(trailing_value3, color=color.rgb(184, 0, 65), linewidth=1, title='Trailing %50')
// Haftalık 9 WMA'nın %60 fazlasını hesapla
percent_increase4 = input.int(70, title="Percent Increase") / 100
// ATR'yi kullanmadan %60 artıÅı hesapla
trailing_percent4 = 1 + percent_increase4
trailing_value4 = out3 * trailing_percent4
// Plot the trailing line
plot(trailing_value4, color=color.rgb(184, 0, 65), linewidth=1, title='Trailing %70')
///kijunsel
Midpoint(length) =>
math.avg(ta.highest(length), ta.lowest(length))
kijunTimeFrame = input.timeframe('1W', group="kijunsen")
kijunPeriods = input.int(20, title='Kijun Periods', minval=1, group="kijunsen")
kijun = request.security(syminfo.tickerid, kijunTimeFrame, Midpoint(kijunPeriods))
plot(kijun, title='Kijun Target', color=color.new(#820179, 0), linewidth=2)
/////BAR HACÄ°M
length77 = input.int(21, 'length', minval=1, group="HACÄ°M BAR")
avrg = ta.sma(volume, length77)
vold1 = volume > avrg * 1.5 and close < open
vold2 = volume >= avrg * 0.5 and volume <= avrg * 1.5 and close < open
vold3 = volume < avrg * 0.5 and close < open
volu1 = volume > avrg * 1.5 and close > open
volu2 = volume >= avrg * 0.5 and volume <= avrg * 1.5 and close > open
volu3 = volume < avrg * 0.5 and close > open
cold1 = #800000
cold2 = #FF0000
cold3 = color.orange
colu1 = #006400
colu2 = color.lime
colu3 = #7FFFD4
color_1 = vold1 ? cold1 : vold2 ? cold2 : vold3 ? cold3 : volu1 ? colu1 : volu2 ? colu2 : volu3 ? colu3 : na
barcolor(color_1)
ARANLAR İndikatörü Pine Editöre kaydedin ..
PHP Code:
// This Pine Script⢠code is subject to the terms of the Mozilla Public License 2.0 at https://mozilla.org/MPL/2.0/
// © YATIRIM_ANALIZ
//@version=5
indicator("ARANLAR", shorttitle='ARANLAR', overlay=true, max_bars_back=4000)
src = input(close, title='Source')
/////////////////////7
b4 = input(title='Factor4', defval=0.7)
c14 = -b4 * b4 * b4
c24 = 3 * b4 * b4 + 3 * b4 * b4 * b4
c34 = -6 * b4 * b4 - 3 * b4 - 3 * b4 * b4 * b4
c44 = 1 + 3 * b4 + b4 * b4 * b4 + 3 * b4 * b4
t34(len) =>
c14 * ta.ema(ta.ema(ta.ema(ta.ema(ta.ema(ta.ema(close, len), len), len), len), len), len) + c24 * ta.ema(ta.ema(ta.ema(ta.ema(ta.ema(close, len), len), len), len), len) + c34 * ta.ema(ta.ema(ta.ema(ta.ema(close, len), len), len), len) + c44 * ta.ema(ta.ema(ta.ema(close, len), len), len)
t3plot4 = t34(input(title='Period4', defval=8))
linewidth = input(title='Linewidth', defval=3)
col1 = t3plot4 > t3plot4[1]
col3 = t3plot4 < t3plot4[1]
color_1 = col1 ? color.rgb(0, 126, 4) : col3 ? color.rgb(171, 0, 0) : color.yellow
plot(t3plot4, color=color_1, linewidth=3, title='T3')
len5 = input.int(5, minval=1, title='9wma')
out5 = ta.wma(src, len5)
// plot(out5, color=color.rgb(33, 178, 0), linewidth=2, title='WMA9')
len13 = input.int(15, minval=1, title='15WMA')
out13 = ta.wma(src, len13)
// plot(out13, color=color.rgb(249, 166, 1), linewidth=2, title='WMA15')
// Al/Sat Sinyalleri
longCondition = ta.crossover(out5, out13)
shortCondition = ta.crossunder(out5, out13)
//Al/Sat Etiketleri
plotshape(longCondition ? true : na, color=color.new(#44c200, 0), style=shape.labelup, title= "AL", location=location.belowbar, size=size.small, textcolor=color.white, text='AL')
plotshape(shortCondition ? true : na, color=color.new(#ff0000, 0), style=shape.labeldown, title= "SAT", location=location.abovebar, size=size.small, textcolor=color.white, text='SAT')
// ///////////////////////////////////7
length111 = input(100, title="Periyot UzunluÄu", group="YOD")
// selectedTimeframe = input.timeframe(defval='1D', title="Zaman Periyodu")
a = ta.highest(close, length111)
b = (ta.highest(close, length111) + ta.lowest(close, length111)) /2
c = ta.lowest(close, length111)
plot(a, title="a", linewidth=2, color=color.rgb(0, 123, 223))
plot(b, title="b", linewidth=2, color=color.rgb(42, 132, 0))
plot(c, title="c", linewidth=2, color=color.rgb(167, 139, 1))
///////////////////////FIBO
// //
fibonacciLookback = input.int(250, title="LOOKBACK")
tepe = ta.highest(close, fibonacciLookback)
dip = ta.lowest(close, fibonacciLookback)
mutlakDeger(sayi) =>
math.abs(sayi)
tepeyeUzaklik = mutlakDeger(ta.highestbars(fibonacciLookback))
dibeUzaklik = mutlakDeger(ta.lowestbars(fibonacciLookback))
fibHesapla(deger) =>
dibeUzaklik > tepeyeUzaklik ? tepe - ((tepe - dip) * deger / 1000) : dip + ((tepe - dip) * deger / 1000)
fib000 = fibHesapla(0)
// fib110 = fibHesapla(110)
fib240 = fibHesapla(240)
fib382 = fibHesapla(380)
fib500 = fibHesapla(500)
fib618 = fibHesapla(618)
// fib720 = fibHesapla(720)
fib790 = fibHesapla(790)
fib890 = fibHesapla(890)
fib1000 = fibHesapla(1000)
fib1140 = fibHesapla(1140)
fib1618 = fibHesapla(1618)
fib2618 = fibHesapla(2618)
var label label000 = na
// var label label110 = na
var label label240 = na
var label label382 = na
var label label500 = na
var label label618 = na
// var label label720 = na
var label label790 = na
var label label890 = na
var label label1000 = na
var label label1140 = na
var label label1618 = na
var label label2618 = na
if bar_index == bar_index
label.delete(label000)
// label.delete(label110)
label.delete(label240)
label.delete(label382)
label.delete(label500)
label.delete(label618)
// label.delete(label720)
label.delete(label790)
label.delete(label890)
label.delete(label1000)
label.delete(label1140)
label.delete(label1618)
label.delete(label2618)
renkfib0 = input.color(defval = color.rgb(0, 6, 10)) // Label rengini burada ayarlayın
// renkfib110 = input.color(defval = color.blue)
renkfib240 = input.color(defval = color.blue)
renkfib382 = input.color(defval = color.rgb(254, 74, 3))
renkfib500 = input.color(defval = color.rgb(0, 0, 0))
renkfib618 = input.color(defval = color.rgb(209, 122, 0))
// renkfib720 = input.color(defval = color.rgb(212, 128, 1))
renkfib790 = input.color(defval = color.rgb(212, 128, 1))
renkfib890 = input.color(defval = color.rgb(212, 128, 1))
renkfib1 = input.color(defval = color.blue)
renkfib1140 = input.color(defval = color.blue)
renkfib1618 = input.color(defval = color.blue)
renkfib2618 = input.color(defval = color.blue)
text_color = input.color(defval = color.rgb(16, 0, 0)) // Metin rengini burada ayarlayın
label000 := label.new(x=bar_index+15, y=fib000-1, text="0 : " + str.tostring(fib000), color=renkfib0, textcolor=text_color, style=label.style_none)
// label110 := label.new(x=bar_index+15, y=fib110-1, text="0.110 : " + str.tostring(fib110), color=renkfib110, textcolor=text_color, style=label.style_none)
label240 := label.new(x=bar_index+15, y=fib240-1, text="0.240 : " + str.tostring(fib240), color=renkfib240, textcolor=text_color, style=label.style_none)
label382 := label.new(x=bar_index+15, y=fib382-1, text="0.382 : " + str.tostring(fib382), color=renkfib382, textcolor=text_color, style=label.style_none)
label500 := label.new(x=bar_index+15, y=fib500-1, text="0.5 : " + str.tostring(fib500), color=renkfib500, textcolor=text_color, style=label.style_none)
label618 := label.new(x=bar_index+15, y=fib618-1, text="0.618 : " + str.tostring(fib618), color=renkfib618, textcolor=text_color, style=label.style_none)
// label720 := label.new(x=bar_index+15, y=fib720-1, text="0.720 : " + str.tostring(fib720), color=renkfib720, textcolor=text_color, style=label.style_none)
label790 := label.new(x=bar_index+15, y=fib790-1, text="0.790 : " + str.tostring(fib790), color=renkfib790, textcolor=text_color, style=label.style_none)
label890 := label.new(x=bar_index+15, y=fib890-1, text="0.890 : " + str.tostring(fib890), color=renkfib890, textcolor=text_color, style=label.style_none)
label1000 := label.new(x=bar_index+15, y=fib1000-1, text="1: " + str.tostring(fib1000), color=renkfib1, textcolor=text_color, style=label.style_none)
label1140 := label.new(x=bar_index+15, y=fib1140-1, text="1140 : " + str.tostring(fib1140), color=renkfib1140, textcolor=text_color, style=label.style_none)
label1618 := label.new(x=bar_index+15, y=fib1618-1, text="1618 : " + str.tostring(fib1618), color=renkfib1618, textcolor=text_color, style=label.style_none)
label2618 := label.new(x=bar_index+15, y=fib2618-1, text="2618 : " + str.tostring(fib2618), color=renkfib2618, textcolor=text_color, style=label.style_none)
k1 = plot(fib000, color=color.rgb(9, 0, 7), linewidth=1, title='fib 0')
// k2 = plot(fib110, color=color.rgb(210, 0, 165), linewidth=1, title='fib 110')
k3 = plot(fib240, color=color.rgb(210, 0, 165), linewidth=1, title='fib 240')
k4 = plot(fib382, color=color.rgb(210, 0, 165), linewidth=1, title='fib 382')
k5 = plot(fib500, color=color.rgb(191, 0, 0), linewidth=2, title='fib 500')
k6 = plot(fib618, color=color.rgb(191, 0, 0), linewidth=2, title='fib 618')
// k7 = plot(fib720, color=color.rgb(210, 0, 165), linewidth=1, title='fib 720')
k8 = plot(fib790, color=color.rgb(210, 126, 0), linewidth=1, title='fib 790')
k9 = plot(fib890, color=color.rgb(210, 126, 0), linewidth=1, title='fib 890')
k10 = plot(fib1000, color=color.rgb(7, 0, 5), linewidth=1, title='fib 1000')
k11= plot(fib1140, color=color.rgb(210, 0, 165), linewidth=1, title='fib 1272')
k12 = plot(fib1618, color=color.rgb(210, 0, 165), linewidth=1, title='fib 1618')
k13 = plot(fib2618, color=color.rgb(210, 0, 165), linewidth=1, title='fib 2618')
fill(k5, k6, color=color.rgb(9, 245, 17, 44), transp=90, title = "fib 500-618")
fill(k8, k9, color=color.rgb(9, 245, 17, 44), transp=90, title = "fib 790-890")
UMURLU 5-8-13 İndikatörü Pine Editöre kaydedin .
PHP Code:
////Written by YO


//@version=5

indicator(shorttitle='UMURLU-5-8-13', title='UMURLU-5-8-13', overlay=true)


src = input(close, title='Source')


//5-8-13 Signal

len5 = input.int(5, minval=1, title='5EMA')

out5 = ta.ema(src, len5)

plot(out5, color=color.rgb(33, 178, 0), linewidth=2, title='EMA5')


len8 = input.int(8, minval=1, title='8EMA')

out8 = ta.ema(src, len8)

plot(out8, color=color.rgb(255, 196, 0), linewidth=1, title='EMA8')


len13 = input.int(13, minval=1, title='13EMA')

out13 = ta.ema(src, len13)

plot(out13, color=color.rgb(63, 2, 197), linewidth=2, title='EMA13')


// Al/Sat Sinyalleri

longCondition = ta.crossover(out5, out13)

shortCondition = ta.crossunder(out5, out13)


//Al/Sat Etiketleri

plotshape(longCondition ? true : na, color=color.new(#44c200, 0), style=shape.labelup, title= "AL", location=location.belowbar, size=size.small, textcolor=color.white, text='AL')

plotshape(shortCondition ? true : na, color=color.new(#ff0000, 0), style=shape.labeldown, title= "SAT", location=location.abovebar, size=size.small, textcolor=color.white, text='SAT')


/////////////bollınger

length = input.int(20, minval=1, title='BB MA')

src9 = input(close, title='BB Source')

mult = input.float(2.0, minval=0.001, maxval=50, title='Narrow BB Multitude')


basis = ta.sma(src9, length)

dev = mult * ta.stdev(src9, length)

upper = basis + dev

lower = basis - dev

plot(basis, color=color.new(#d70081, 0), title='BB MA')

p1 = plot(upper, color=color.new(color.green, 50), title='Narrow Upper')

p2 = plot(lower, color=color.new(color.red, 50), title='Narrow Lower')


length1 = input.int(20, minval=1, title='Wide BB Length')

mult1 = input.float(3.0, minval=0.001, maxval=50, title='Wide BB Multitude')

basis1 = ta.sma(src9, length1)

dev1 = mult1 * ta.stdev(src9, length)

upper1 = basis1 + dev1

lower1 = basis1 - dev1


p3 = plot(upper1, color=color.new(color.green, 50), title='Wide Higher')

p4 = plot(lower1, color=color.new(color.red, 50), title='Wide Lower')

fill(p3, p1, color=color.new(color.green, 95), title='Upper Fill')

fill(p4, p2, color=color.new(color.red, 95), title='Lower Fill')
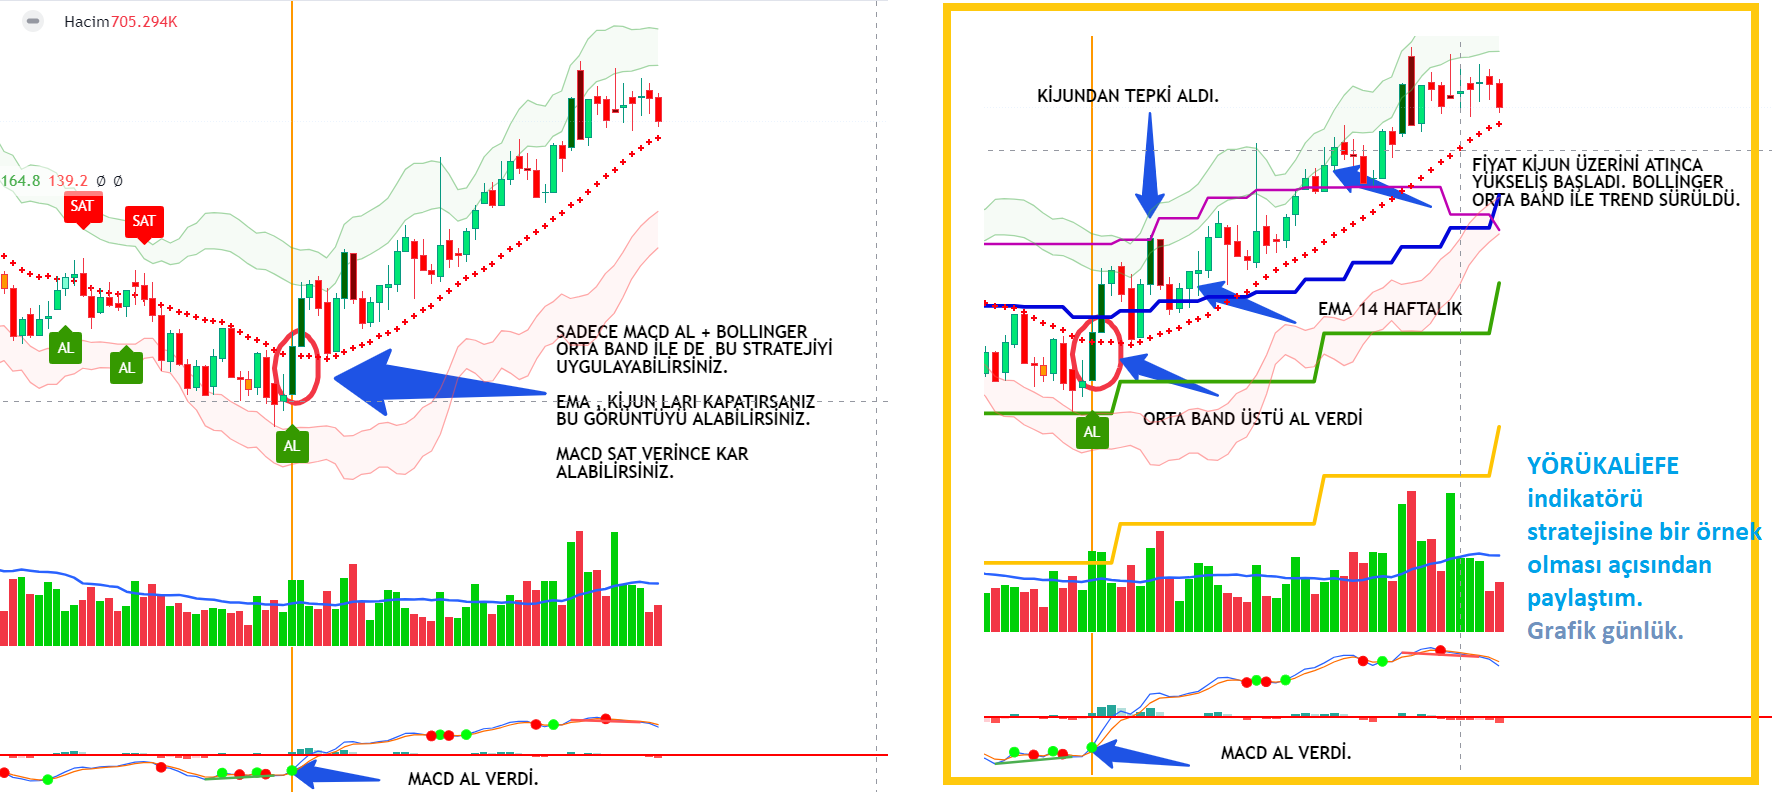
YÖRÜKALİEFE indikatöründe sadece Aşağıda yazılan stratejiyi de uygulayabilirsiniz.
MACD al - fiyat orta band üstünde kapanışta alım yapabilir, Fiyat orta band altında kapanış, MACD sat verince satabilirsiniz.
"YÖRÜK ALİ EFE" indikatörünü paylaşacağım. İndikatörü Günlük ve Haftalık kullanırsanız daha fazla faydasını görebilirsiniz.
İndikatör içerisinde;
- EMA 14 HAFTALIK- EMA 8-EMA 14 AYLIK HO
- BOLLİNGER BANDI
- KIJUNSEN indikatörlerini kullandım.
PHP Code:
//@version=5
indicator('YÃRÃKALÄ°EFE', shorttitle='YÃRÃKALÄ°EFE', overlay=true)
ma3_len = input(14, "Length", group='EMA')
src3 = input(close, "Source")
res3 = input.timeframe('1W', "Resolution", title="EMA14Periyod")
htf_ma3 = ta.ema(src3, ma3_len)
out3 = request.security(syminfo.tickerid, res3, htf_ma3)
plot(out3, color=color.rgb(2, 6, 218), linewidth=3, title='EMA-14 HAFTALIK')
ma4_len = input.int(8, "Length", group='EMA')
src4 = input(close, "Source")
res4 = input.timeframe('1M', "Resolution", title="EMA8 AYLIK")
htf_ma4 = ta.ema(src4, ma4_len)
out4 = request.security(syminfo.tickerid, res4, htf_ma4)
plot(out4, color=color.rgb(57, 165, 3), linewidth=3, title='EMA8 AYLIK')
ma41_len = input.int(14, "Length", group='EMA')
src41 = input(close, "Source")
res41 = input.timeframe('1M', "Resolution", title="EMA14 Aylık")
htf_ma41 = ta.ema(src41, ma41_len)
out41 = request.security(syminfo.tickerid, res41, htf_ma41)
plot(out41, color=color.rgb(255, 196, 3), linewidth=3, title='EMA14 AYLIK')
///kijunsel
Midpoint(length) =>
math.avg(ta.highest(length), ta.lowest(length))
kijunTimeFrame = input.timeframe('1W', group="kijunsen")
kijunPeriods = input.int(20, title='Kijun Periods', minval=1, group="kijunsen")
kijun = request.security(syminfo.tickerid, kijunTimeFrame, Midpoint(kijunPeriods))
plot(kijun, title='Kijun Target', color=color.new(#bf01b2, 0), linewidth=2)
////////////////////////////////////////////////////7
/////////////bollınger
length98 = input.int(20, minval=1, title='BB MA')
src9 = input(close, title='BB Source')
mult = input.float(2.0, minval=0.001, maxval=50, title='Narrow BB Multitude')
basis = ta.sma(src9, length98)
dev = mult * ta.stdev(src9, length98)
upper = basis + dev
lower = basis - dev
plot(basis, color=color.new(#fc000d, 0), linewidth=2, title='ORTA ÃÄ°ZGÄ°')
p1 = plot(upper, color=color.new(color.green, 50), title='Narrow Upper')
p2 = plot(lower, color=color.new(color.red, 50), title='Narrow Lower')
length198 = input.int(20, minval=1, title='Wide BB Length')
mult1 = input.float(3.0, minval=0.001, maxval=50, title='Wide BB Multitude')
basis1 = ta.sma(src9, length198)
dev1 = mult1 * ta.stdev(src9, length198)
upper1 = basis1 + dev1
lower1 = basis1 - dev1
p3 = plot(upper1, color=color.new(color.green, 50), title='Wide Higher')
p4 = plot(lower1, color=color.new(color.red, 50), title='Wide Lower')
fill(p3, p1, color=color.new(color.green, 95), title='Upper Fill')
fill(p4, p2, color=color.new(color.red, 95), title='Lower Fill')
// Al/Sat Sinyalleri
longCondition = ta.crossover(close, basis)
shortCondition = ta.crossunder(close, basis)
//Al/Sat Etiketleri
plotshape(longCondition ? true : na, color=color.new(#359900, 0), style=shape.labelup, title= "AL", location=location.belowbar, size=size.small, textcolor=color.white, text='AL')
plotshape(shortCondition ? true : na, color=color.new(#ff0000, 0), style=shape.labeldown, title= "SAT", location=location.abovebar, size=size.small, textcolor=color.white, text='SAT')
/////BAR HACÄ°M
length77 = input.int(21, 'length', minval=1, group="HACÄ°M BAR")
avrg = ta.sma(volume, length77)
vold1 = volume > avrg * 1.5 and close < open
vold2 = volume >= avrg * 0.5 and volume <= avrg * 1.5 and close < open
vold3 = volume < avrg * 0.5 and close < open
volu1 = volume > avrg * 1.5 and close > open
volu2 = volume >= avrg * 0.5 and volume <= avrg * 1.5 and close > open
volu3 = volume < avrg * 0.5 and close > open
cold1 = #800000
cold2 = #FF0000
cold3 = color.orange
colu1 = #006400
colu2 = color.lime
colu3 = #7FFFD4
color_1 = vold1 ? cold1 : vold2 ? cold2 : vold3 ? cold3 : volu1 ? colu1 : volu2 ? colu2 : volu3 ? colu3 : na
barcolor(color_1)
MUSLUCA indikatörü Editör Pine ye kaydedebilirsiniz
PHP Code:
//@version=5
indicator('MUSLUCA-4S', shorttitle='MUSLUCA-4S', overlay=true, max_bars_back=4000)
/////////////////////GRAFÄ°K
// EMA-14
ma8_len = input(8, "Length", group='EMA')
src8 = input(close, "Source")
res8 = input.timeframe('240', "Resolution", title="EMA-8 4S")
htf_ma8 = ta.ema(src8, ma8_len)
out8 = request.security(syminfo.tickerid, res8, htf_ma8)
plot(out8, color=color.rgb(15, 186, 3), linewidth=2, title='EMA8 4S')
ma18_len = input(55, "Length", group='EMA')
src18 = input(close, "Source")
res18 = input.timeframe('240', "Resolution", title="EMA55 4S")
htf_ma18 = ta.ema(src18, ma18_len)
out18 = request.security(syminfo.tickerid, res18, htf_ma18)
plot(out18, color=color.rgb(241, 6, 6), linewidth=2, style=plot.style_cross, title='EMA55 4S')
ma28_len = input(8, "Length", group='EMA')
src28 = input(close, "Source")
res28 = input.timeframe('1D', "Resolution", title="EMA8 GÃNLÃK")
htf_ma28 = ta.ema(src28, ma28_len)
out28 = request.security(syminfo.tickerid, res28, htf_ma28)
plot(out28, color=color.rgb(228, 1, 134), linewidth=2, title='EMA8 GÃNLÃK')
/////////////////////
ma3_len = input(9, "Length", group='WMA')
src3 = input(close, "Source")
res3 = input.timeframe('1W', "Resolution", title="wma9Periyod")
htf_ma3 = ta.wma(src3, ma3_len)
out3 = request.security(syminfo.tickerid, res3, htf_ma3)
plot(out3, color=color.rgb(10, 147, 0), linewidth=3, title='WMA-9HAFTALIK')
ma4_len = input.int(15, "Length", group='WMA')
src4 = input(close, "Source")
res4 = input.timeframe('1W', "Resolution", title="wma15Periyod")
htf_ma4 = ta.wma(src4, ma4_len)
out4 = request.security(syminfo.tickerid, res4, htf_ma4)
plot(out4, color=color.rgb(255, 136, 0), linewidth=3, title='WMA-15HAFTALIK')
// Haftalık 9 EMA'nın %15 fazlasını hesapla
percent_increase = input.int(15, title="Percent Increase") / 100
// ATR'yi kullanmadan %15 artıÅı hesapla
trailing_percent = 1 + percent_increase
trailing_value = out3 * trailing_percent
// Plot the trailing line
plot(trailing_value, color=color.rgb(0, 4, 7), linewidth=2, style=plot.style_cross, title='Trailing %15')
// Haftalık 9 WMA'nın %30 fazlasını hesapla
percent_increase1 = input.int(30, title="Percent Increase") / 100
// ATR'yi kullanmadan %30 artıÅı hesapla
trailing_percent1 = 1 + percent_increase1
trailing_value1 = out3 * trailing_percent1
// Plot the trailing line
plot(trailing_value1, color=color.rgb(255, 0, 0), linewidth=1, title='Trailing %30')
/////
// Haftalık 9 WMA'nın %40 fazlasını hesapla
percent_increase2 = input.int(40, title="Percent Increase") / 100
// ATR'yi kullanmadan %40 artıÅı hesapla
trailing_percent2 = 1 + percent_increase2
trailing_value2 = out3 * trailing_percent2
// Plot the trailing line
plot(trailing_value2, color=color.rgb(255, 136, 0), linewidth=1, title='Trailing %40')
///////
// Haftalık 9 WMA'nın %50 fazlasını hesapla
percent_increase3 = input.int(50, title="Percent Increase") / 100
// ATR'yi kullanmadan %60 artıÅı hesapla
trailing_percent3 = 1 + percent_increase3
trailing_value3 = out3 * trailing_percent3
// Plot the trailing line
plot(trailing_value3, color=color.rgb(184, 0, 65), linewidth=1, title='Trailing %50')
// Haftalık 9 WMA'nın %60 fazlasını hesapla
percent_increase4 = input.int(70, title="Percent Increase") / 100
// ATR'yi kullanmadan %60 artıÅı hesapla
trailing_percent4 = 1 + percent_increase4
trailing_value4 = out3 * trailing_percent4
// Plot the trailing line
plot(trailing_value4, color=color.rgb(184, 0, 65), linewidth=1, title='Trailing %70')
///kijunsel
Midpoint(length) =>
math.avg(ta.highest(length), ta.lowest(length))
kijunTimeFrame = input.timeframe('1W', group="kijunsen")
kijunPeriods = input.int(20, title='Kijun Periods', minval=1, group="kijunsen")
kijun = request.security(syminfo.tickerid, kijunTimeFrame, Midpoint(kijunPeriods))
plot(kijun, title='Kijun Target', color=color.new(#820179, 0), linewidth=2)
/////BAR HACÄ°M
length77 = input.int(21, 'length', minval=1, group="HACÄ°M BAR")
avrg = ta.sma(volume, length77)
vold1 = volume > avrg * 1.5 and close < open
vold2 = volume >= avrg * 0.5 and volume <= avrg * 1.5 and close < open
vold3 = volume < avrg * 0.5 and close < open
volu1 = volume > avrg * 1.5 and close > open
volu2 = volume >= avrg * 0.5 and volume <= avrg * 1.5 and close > open
volu3 = volume < avrg * 0.5 and close > open
cold1 = #800000
cold2 = #FF0000
cold3 = color.orange
colu1 = #006400
colu2 = color.lime
colu3 = #7FFFD4
color_1 = vold1 ? cold1 : vold2 ? cold2 : vold3 ? cold3 : volu1 ? colu1 : volu2 ? colu2 : volu3 ? colu3 : na
barcolor(color_1)
*Dosyanın içindeki kodları kopyalayın.
*TW de pineeditör kısmına gelin.
*Aç bölümüne basın.
*Altta yeni gösterge bölümünü açın.
*Açılan bölümdeki tüm kodları silin.
*Kopyaladığınız kodları bunun içine sol taraftan boşluk kalmayacak şekilde yapıştırın.
*Kaydet ve grafiğe ekleye basın.
*Favorilere ekle.
https://twitter.com/yatirim_analiz_ isimli üyeden alıntıladım daha fazla kişiye ulaşabilsin diye


 Alıntı yaparak yanıtla

 Yeni Üye


Originally Posted by ahmetdamar

 Gönderi Kuralları


Yer İmleri