https://tr.tradingview.com/v/AP50fvlX/
https://tr.tradingview.com/v/nMkQmtsu/
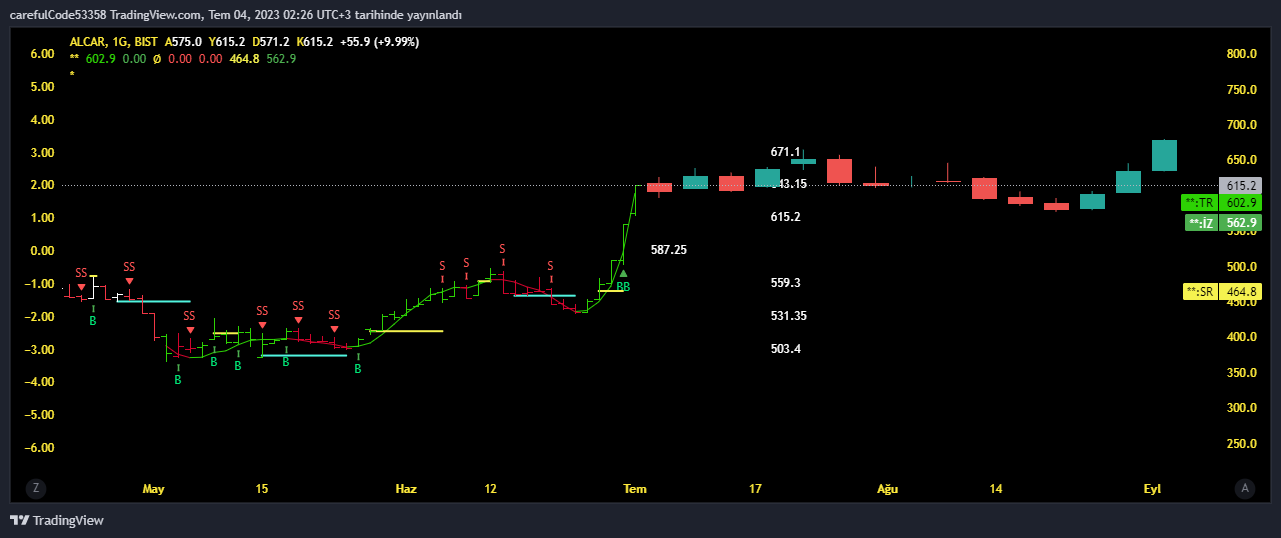
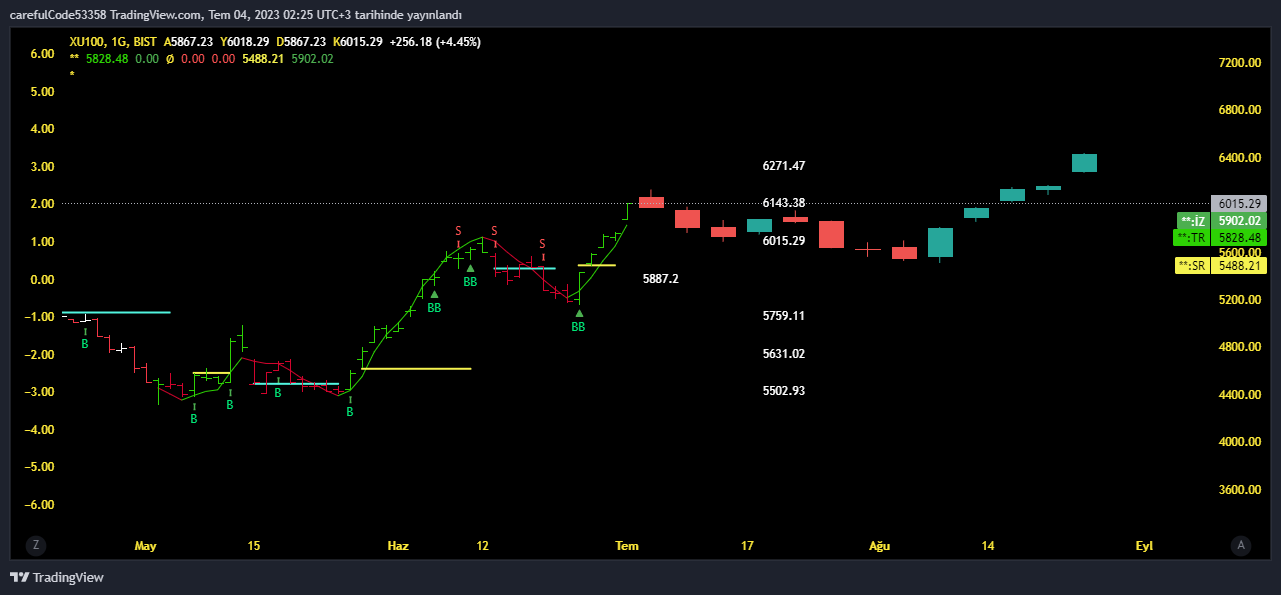
bu iki kodda...10 atr ile trend hesaplaması yapıyor....
https://www.tradingview.com/x/kRQCCI8t/
biri tableli...diğeri değil....
birinin üzerinden combine derleme ...
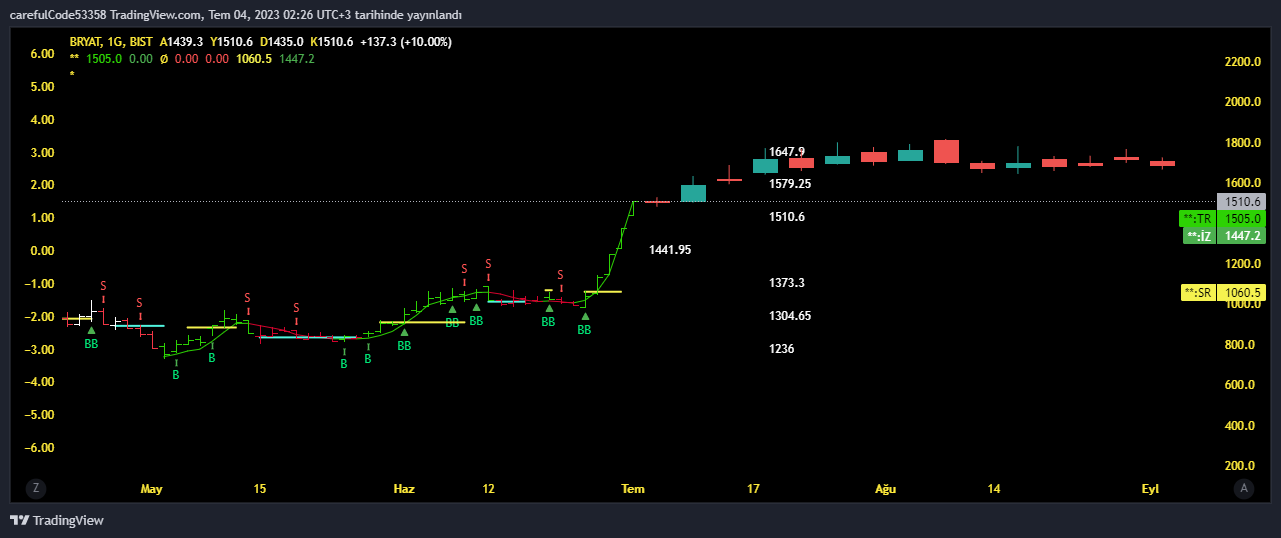
https://tr.tradingview.com/v/zFk8Fpr3/ bunu ekleyelim....
eklenmiş görüntü....https://www.tradingview.com/x/XT29Qy9k/
PHP Code:
  //@version=5

indicator(title = "Farzan Paid Caliburn",  precision=2, overlay = true)


bull1 = input(color.green, "Regular", group="Bullish Colors", inline="Bullish Colors")

bull2 = input(color.green, "Outside", group="Bullish Colors", inline="Bullish Colors")

mid1 = input(color.green,  "Inside", group="Bullish Colors", inline="Bullish Colors")


bear1 = input(color.red,  "Regular", group="Bearish Colors", inline="Bearish Colors")

bear2 = input(color.red, "Outside",  group="Bearish Colors", inline="Bearish Colors")

mid2 = input(color.red,    "Inside", group="Bearish Colors", inline="Bearish Colors")


inside = high < high[1] and low > low[1]

outside = high > high[1] and low < low[1]

bull = close > open

bear = open > close


candlecol = bull? (inside? mid1 : outside? bull2 : bull1) : bear? (inside? mid2 : outside? bear2 : bear1) : color.gray


bodycol = color.new(candlecol, 00)


//plotcandle(open,high,low,close, color = bodycol, bordercolor = candlecol, wickcolor = candlecol)


atrPeriod = input(10, "ATR Length")

factor = input.float(3.0, "Factor", step = 0.01)


[supertrend, direction] = ta.supertrend(factor, atrPeriod)


bodyMiddle = plot((open + close) / 2, display=display.none)

upTrend = plot(direction < 0 ? supertrend : na, "Up Trend", color = color.green, style=plot.style_linebr)

downTrend = plot(direction < 0? na : supertrend, "Down Trend", color = color.red, style=plot.style_linebr)


//fill(bodyMiddle, upTrend, color.new(color.green, 90), fillgaps=false)

//fill(bodyMiddle, downTrend, color.new(color.red, 90), fillgaps=false)

///////////////////////////////////

//@version=5


// Define input variables

emaLength = input.int(5, minval=1, title='EMA Length')

rsiLength = input.int(14, minval=1, title='RSI Length')

rsiOverbought = input(80, title='RSI Overbought Level')

rsiOversold = input(20, title='RSI Oversold Level')


start = input.float(title='Start', step=0.001, defval=0.05)

increment = input.float(title='Increment', step=0.001, defval=0.075)

maximum = input.float(title='Maximum', step=0.01, defval=0.35)

width = input.int(title='Point Width', minval=1, defval=2)


psar = ta.sar(start, increment, maximum)

dir = psar < close ? 1 : -1


psarColor = dir == 1 ? #3388bb : #fdcc02

//psarPlot = plot(psar, title='PSAR', style=plot.style_circles, linewidth=width, color=color.new(psarColor,0))


// Calculate EMA

emaValue = ta.ema(close, emaLength)


// Calculate RSI

rsiValue = ta.rsi(close, rsiLength)


// Define variables

var bool strongLongSignal = false

var bool strongShortSignal = false

highlightState = input(title='Highlight State ?', defval=true)

src = input(close, title='Source')


// Plotting

//plot(rsiValue, title='RSI', color=color.new(color.red, 0))


// Determine long and short signals based on conditions

strongLongSignal := high[1] < emaValue[1] and high > high[1] and rsiValue > rsiOversold and rsiValue > rsiValue[1]

longSignal = strongLongSignal

strongShortSignal := low[1] > emaValue[1] and low < low[1] and rsiValue < rsiOverbought and rsiValue < rsiValue[1]

shortSignal = strongShortSignal


// Buy Signal as per PSR

buySignalPSR = dir == 1 and dir[1] == -1

sellSignalPSR = dir == -1 and dir[1] == 1


//5-8-13 Signal

len5 = input.int(5, minval=1, title='5EMA')

out5 = ta.ema(src, len5)

emaValue5 = ta.ema(close, len5)


len8 = input.int(8, minval=1, title='8EMA')

out8 = ta.ema(src, len8)

emaValue8 = ta.ema(close, len8)


len13 = input.int(13, minval=1, title='13EMA')

out13 = ta.ema(src, len13)

emaValue13 = ta.ema(close, len13)


//Plot 5-8-13 EMA on Chart

//plot(out5, title='EMA5', color=color.new(color.red, 0), linewidth=1)

//plot(out8, title='EMA8', color=color.new(color.blue, 0), linewidth=1)

//plot(out13, title='EMA13', color=color.new(color.green, 0), linewidth=1)


// 5-8-13 EMA Buy Sell Signals Calculation

long5813 = ((ta.crossover(emaValue5, emaValue8) or emaValue5 > emaValue8) and

           (ta.crossover(emaValue5, emaValue13) or emaValue5 > emaValue13) and

           (buySignalPSR or dir == 1) and close > close[1] and

           close > emaValue5 and close > emaValue8 and close > emaValue13)


short5813 = (((ta.crossunder(emaValue5, emaValue8) or emaValue5 < emaValue8) and

              (ta.crossunder(emaValue5, emaValue13) or emaValue5 < emaValue13)) and

             (sellSignalPSR or dir == -1) and close < close[1] and

             close < emaValue5 and close < emaValue8 and close < emaValue13)


//Recheck Quick Buy and Sell Signals before plotting

if short5813

    longSignal := false


if long5813

    shortSignal := false


// Plot long and short signals

plotshape(not longSignal[1] ? longSignal : na, color=color.new(color.green, 0), style=shape.arrowup, text='QB', title='Quick Buy', location=location.belowbar)

plotshape(not long5813[1] ? long5813 : na, title='Strong Buy', color=color.new(color.green, 0), style=shape.triangleup, text='SB',location =location.belowbar)

plotshape(not shortSignal[1] ? shortSignal : na, color=color.new(color.red, 0), style=shape.arrowdown, text='QS',title='Quick Sell', location=location.abovebar, textcolor=color.new(color.red,0))

plotshape(not short5813[1] ? short5813 : na, title='Strong Sell', color=color.new(color.red, 0), style=shape.triangledown, text='SS', location=location.abovebar,textcolor=color.new(color.red,0))


midPricePlot = plot(ohlc4, title='PSAR Plot', display=display.none)

fillColor = highlightState ? dir == 1 ? color.green : color.red : na

//fill(midPricePlot, psarPlot, title='Trade State Filling', color=color.new(fillColor,90))


alertcondition(not longSignal[1] ? longSignal : na, 'Scalp Buy Signal', 'Scalp Buy/Long')

alertcondition(not long5813[1] ? long5813 : na, 'Strong Buy Signal', 'Buy/Long')

alertcondition(not shortSignal[1] ? shortSignal : na, 'Scalp Sell Signal', 'Scalp Sell/Short')

alertcondition(not short5813[1] ? short5813 : na, 'Strong Sell Signal', 'Sell/Short')
https://tr.tradingview.com/v/gThgCf69/ belki bu eklenebilir gibi....
https://www.tradingview.com/x/YFGR0Oec/
https://tr.tradingview.com/v/Cc7xGmYO/ bunda bar renklendirme olunca...
ve yaklaşık olarak supertrendle aynı değerler söz konusu olunca.....
böyle daha mantıklı gibi.....
PHP Code:
// This source code is subject to these terms:
// Attribution-NonCommercial 4.0 International (CC BY-NC 4.0)
// https://creativecommons.org/licenses/by-nc/4.0/
// You are free to Share, copy and redistribute. Adapt, transform and re-build on this script.
// Under the following terms: Non-commercial & Attribution.
// © gu5tavo71 (Gustavo Cardelle)
//@version=5
VERSION = 'v1.4.42'
indicator(
'Donchian Channels [Gu5]',
shorttitle = 'DC ' + VERSION,
overlay = true,
explicit_plot_zorder = true)
// Donchian Channels developed by Richard Donchian
// Actual Study Version: @gu5tavo71
// 2023.05.12
// Project #687
// This script reuses open source code from another authors:
// @PineCoders, Built-in Library, and Community Scripts
// Disclaimer: I am not a financial advisor.
// For purpose educate only. Use at your own risk.
//#region <constant_declarations> {
//<my colors>
C_GREEN = #006400 //Green
C_GREENLIGHT = #388e3c //Green Light
C_RED = #8B0000 //Red
C_REDLIGHT = #b71c1c //Red Light
//#endregion }
//#region <inputs> {
i_dcLen = input.int (20, 'Length' , minval = 1)
//Display
G_DISPLAY = 'Display'
i_showBasis = input.bool (true, '■ Basis On/Off' , group = G_DISPLAY)
i_alertOn = input.bool (false, '■ Alert On/Off' , group = G_DISPLAY)
i_showFill = input.bool (false, '■ Fill On/Off' , group = G_DISPLAY)
i_showBarCol = input.bool (true, '■ Bar Color On/Off' , group = G_DISPLAY)
i_showClose = input.bool (false, '■ Close Alert On/Off' , group = G_DISPLAY)
//#endregion }
//#region <calculations> {
//<set initial values>
condition = 0.0
dc = 0.0
dcDirCond = 0.0
dcTopDir = 0.0
dcBotDir = 0.0
dcTop = ta.highest(i_dcLen)
dcBot = ta.lowest (i_dcLen)
dcBasis = math.avg(dcTop, dcBot)
dc := dc[1] != 1 and dcTop > dcTop[1] ? 1 :
dc[1] != -1 and dcBot < dcBot[1] ? -1 : nz(dc[1])
dcDirUp = dcTop > dcTop[1]
dcDirDn = dcBot < dcBot[1]
dcDirZero = ta.crossunder(close, dcBasis) or ta.crossover(close, dcBasis)
dcDirCond := dcDirCond[1] != 1 and dcDirUp ? 1 :
dcDirCond[1] != -1 and dcDirDn ? -1 :
dcDirCond[1] != 0 and dcDirZero ? 0 : nz(dcDirCond[1])
dcDir = dcDirCond == 0 ? 0 :
dc == 1 ? 1 : -1
dcTopDir := dcTop < dcTop[1] ? 0 :
dcTop > dcTop[1] ? 1 : nz(dcTopDir[1])
dcBotDir := dcBot > dcBot[1] ? 0 :
dcBot < dcBot[1] ? -1 : nz(dcBotDir[1])
dcRange = dcTopDir == 0 and dcBotDir == 0
//<rules>
longErule = dcTop > dcTop[1]
shortErule = dcBot < dcBot[1]
longXrule = i_showClose ? ta.crossunder(close, dcBasis) : false
shortXrule = i_showClose ? ta.crossover (close, dcBasis) : false
//<conditions>
condition := condition[1] != 1 and longErule ? 1 :
condition[1] != -1 and shortErule ? -1 :
condition[1] != 0 and longXrule ? 0 :
condition[1] != 0 and shortXrule ? 0 : nz(condition[1])
longE = condition[1] != 1 and condition == 1
shortE = condition[1] != -1 and condition == -1
longX = condition[1] == 1 and longXrule
shortX = condition[1] == -1 and shortXrule
// <color>
c_range = dcRange or condition == 0
c_dcTop = c_range ? color.new(color.gray, 75) :
condition == 1 ? color.new(color.green, 0) :
condition == 0 ? color.new(color.orange, 0) :
dcRange ? color.new(color.orange, 0) :
color.new(color.gray, 75)
c_dcBot = c_range ? color.new(color.gray, 75) :
condition == -1 ? color.new(color.red, 0) :
condition == 0 ? color.new(color.orange, 0) :
color.new(color.gray, 75)
c_dcBasis = dcRange ? color.new(color.orange, 0) :
dc == 1 ? color.new(color.green, 25) :
dc == -1 ? color.new(color.red, 25) : na
c_dcFill = dcRange ? color.new(color.orange, 80) :
dc == 1 ? color.new(color.green, 80) :
dc == -1 ? color.new(color.red, 80) : na
c_barCol = c_range and open <= close ? color.new(color.orange, 0) :
c_range and open > close ? color.new(color.yellow, 0) :
condition == 1 and open <= close ? color.new(C_GREEN, 0) :
condition == 1 and open > close ? color.new(color.green, 0) :
condition == -1 and open >= close ? color.new(C_RED, 0) :
condition == -1 and open < close ? color.new(color.red, 0) :
color.new(color.gray, 0)
//#endregion }
//#region <visuals> {
plot(
i_showBasis ? dcBasis : na,
title = 'Basis',
linewidth = 2,
color = c_dcBasis)
barcolor(i_showBarCol ? c_barCol : na)
//#endregion }
///////////////////////////////////
//version=5
// Define input variables
emaLength = input.int(5, minval=1, title='EMA Length')
rsiLength = input.int(14, minval=1, title='RSI Length')
rsiOverbought = input(80, title='RSI Overbought Level')
rsiOversold = input(20, title='RSI Oversold Level')
start = input.float(title='Start', step=0.001, defval=0.05)
increment = input.float(title='Increment', step=0.001, defval=0.075)
maximum = input.float(title='Maximum', step=0.01, defval=0.35)
width = input.int(title='Point Width', minval=1, defval=2)
psar = ta.sar(start, increment, maximum)
dir = psar < close ? 1 : -1
psarColor = dir == 1 ? #3388bb : #fdcc02
//psarPlot = plot(psar, title='PSAR', style=plot.style_circles, linewidth=width, color=color.new(psarColor,0))
// Calculate EMA
emaValue = ta.ema(close, emaLength)
// Calculate RSI
rsiValue = ta.rsi(close, rsiLength)
// Define variables
var bool strongLongSignal = false
var bool strongShortSignal = false
highlightState = input(title='Highlight State ?', defval=true)
src = input(close, title='Source')
// Plotting
//plot(rsiValue, title='RSI', color=color.new(color.red, 0))
// Determine long and short signals based on conditions
strongLongSignal := high[1] < emaValue[1] and high > high[1] and rsiValue > rsiOversold and rsiValue > rsiValue[1]
longSignal = strongLongSignal
strongShortSignal := low[1] > emaValue[1] and low < low[1] and rsiValue < rsiOverbought and rsiValue < rsiValue[1]
shortSignal = strongShortSignal
// Buy Signal as per PSR
buySignalPSR = dir == 1 and dir[1] == -1
sellSignalPSR = dir == -1 and dir[1] == 1
//5-8-13 Signal
len5 = input.int(5, minval=1, title='5EMA')
out5 = ta.ema(src, len5)
emaValue5 = ta.ema(close, len5)
len8 = input.int(8, minval=1, title='8EMA')
out8 = ta.ema(src, len8)
emaValue8 = ta.ema(close, len8)
len13 = input.int(13, minval=1, title='13EMA')
out13 = ta.ema(src, len13)
emaValue13 = ta.ema(close, len13)
//Plot 5-8-13 EMA on Chart
//plot(out5, title='EMA5', color=color.new(color.red, 0), linewidth=1)
//plot(out8, title='EMA8', color=color.new(color.blue, 0), linewidth=1)
//plot(out13, title='EMA13', color=color.new(color.green, 0), linewidth=1)
// 5-8-13 EMA Buy Sell Signals Calculation
long5813 = ((ta.crossover(emaValue5, emaValue8) or emaValue5 > emaValue8) and
(ta.crossover(emaValue5, emaValue13) or emaValue5 > emaValue13) and
(buySignalPSR or dir == 1) and close > close[1] and
close > emaValue5 and close > emaValue8 and close > emaValue13)
short5813 = (((ta.crossunder(emaValue5, emaValue8) or emaValue5 < emaValue8) and
(ta.crossunder(emaValue5, emaValue13) or emaValue5 < emaValue13)) and
(sellSignalPSR or dir == -1) and close < close[1] and
close < emaValue5 and close < emaValue8 and close < emaValue13)
//Recheck Quick Buy and Sell Signals before plotting
if short5813
longSignal := false
if long5813
shortSignal := false
// Plot long and short signals
plotshape(not longSignal[1] ? longSignal : na, color=color.new(color.green, 0), style=shape.arrowup, text='QB', title='Quick Buy', location=location.belowbar)
plotshape(not long5813[1] ? long5813 : na, title='Strong Buy', color=color.new(color.green, 0), style=shape.triangleup, text='SB',location =location.belowbar)
plotshape(not shortSignal[1] ? shortSignal : na, color=color.new(color.red, 0), style=shape.arrowdown, text='QS',title='Quick Sell', location=location.abovebar, textcolor=color.new(color.red,0))
plotshape(not short5813[1] ? short5813 : na, title='Strong Sell', color=color.new(color.red, 0), style=shape.triangledown, text='SS', location=location.abovebar,textcolor=color.new(color.red,0))
midPricePlot = plot(ohlc4, title='PSAR Plot', display=display.none)
fillColor = highlightState ? dir == 1 ? color.green : color.red : na
//fill(midPricePlot, psarPlot, title='Trade State Filling', color=color.new(fillColor,90))
alertcondition(not longSignal[1] ? longSignal : na, 'Scalp Buy Signal', 'Scalp Buy/Long')
alertcondition(not long5813[1] ? long5813 : na, 'Strong Buy Signal', 'Buy/Long')
alertcondition(not shortSignal[1] ? shortSignal : na, 'Scalp Sell Signal', 'Scalp Sell/Short')
alertcondition(not short5813[1] ? short5813 : na, 'Strong Sell Signal', 'Sell/Short')
//////////////////////////
https://www.tradingview.com/x/gddG1fOG/
https://tr.tradingview.com/v/NKpGkblS/
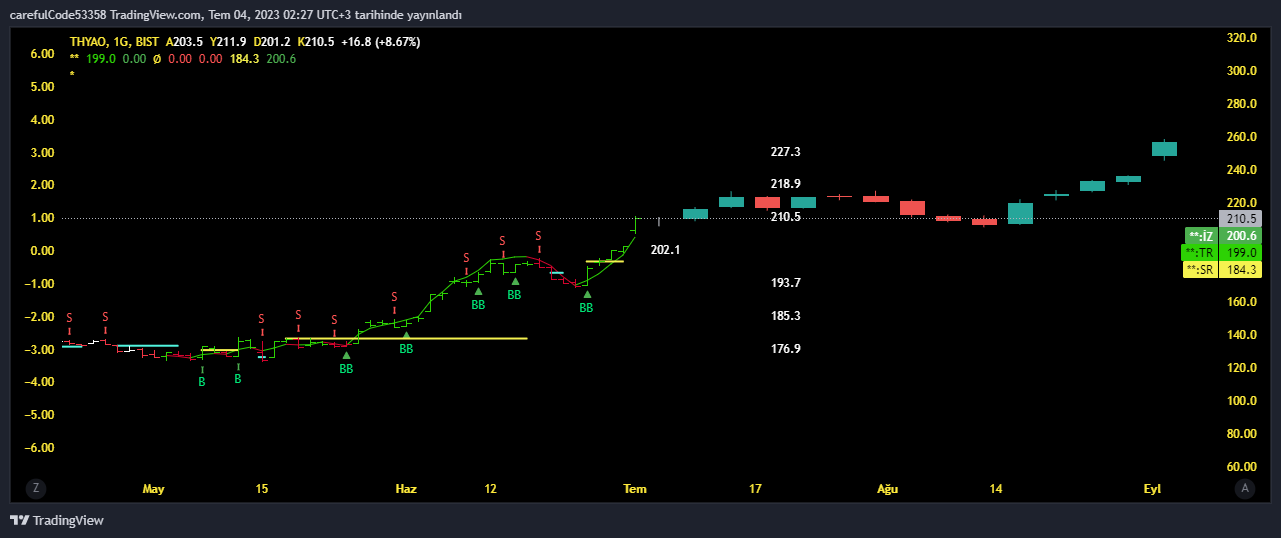
bu eklenince görüntü.... https://www.tradingview.com/x/doQXSm7b/
PHP Code:
// This source code is subject to these terms:
// Attribution-NonCommercial 4.0 International (CC BY-NC 4.0)
// https://creativecommons.org/licenses/by-nc/4.0/
// You are free to Share, copy and redistribute. Adapt, transform and re-build on this script.
// Under the following terms: Non-commercial & Attribution.
// © gu5tavo71 (Gustavo Cardelle)
//@version=5
VERSION = 'v1.4.42'
indicator(
'Donchian Channels [Gu5]',
shorttitle = 'DC ' + VERSION,
overlay = true,
explicit_plot_zorder = true,
max_bars_back = 5000)
// Donchian Channels developed by Richard Donchian
// Actual Study Version: @gu5tavo71
// 2023.05.12
// Project #687
// This script reuses open source code from another authors:
// @PineCoders, Built-in Library, and Community Scripts
// Disclaimer: I am not a financial advisor.
// For purpose educate only. Use at your own risk.
//#region <constant_declarations> {
//<my colors>
C_GREEN = #006400 //Green
C_GREENLIGHT = #388e3c //Green Light
C_RED = #8B0000 //Red
C_REDLIGHT = #b71c1c //Red Light
//#endregion }
//#region <inputs> {
i_dcLen = input.int (20, 'Length' , minval = 1)
//Display
G_DISPLAY = 'Display'
i_showBasis = input.bool (true, '■ Basis On/Off' , group = G_DISPLAY)
i_alertOn = input.bool (false, '■ Alert On/Off' , group = G_DISPLAY)
i_showFill = input.bool (false, '■ Fill On/Off' , group = G_DISPLAY)
i_showBarCol = input.bool (true, '■ Bar Color On/Off' , group = G_DISPLAY)
i_showClose = input.bool (false, '■ Close Alert On/Off' , group = G_DISPLAY)
//#endregion }
//#region <calculations> {
//<set initial values>
condition = 0.0
dc = 0.0
dcDirCond = 0.0
dcTopDir = 0.0
dcBotDir = 0.0
dcTop = ta.highest(i_dcLen)
dcBot = ta.lowest (i_dcLen)
dcBasis = math.avg(dcTop, dcBot)
dc := dc[1] != 1 and dcTop > dcTop[1] ? 1 :
dc[1] != -1 and dcBot < dcBot[1] ? -1 : nz(dc[1])
dcDirUp = dcTop > dcTop[1]
dcDirDn = dcBot < dcBot[1]
dcDirZero = ta.crossunder(close, dcBasis) or ta.crossover(close, dcBasis)
dcDirCond := dcDirCond[1] != 1 and dcDirUp ? 1 :
dcDirCond[1] != -1 and dcDirDn ? -1 :
dcDirCond[1] != 0 and dcDirZero ? 0 : nz(dcDirCond[1])
dcDir = dcDirCond == 0 ? 0 :
dc == 1 ? 1 : -1
dcTopDir := dcTop < dcTop[1] ? 0 :
dcTop > dcTop[1] ? 1 : nz(dcTopDir[1])
dcBotDir := dcBot > dcBot[1] ? 0 :
dcBot < dcBot[1] ? -1 : nz(dcBotDir[1])
dcRange = dcTopDir == 0 and dcBotDir == 0
//<rules>
longErule = dcTop > dcTop[1]
shortErule = dcBot < dcBot[1]
longXrule = i_showClose ? ta.crossunder(close, dcBasis) : false
shortXrule = i_showClose ? ta.crossover (close, dcBasis) : false
//<conditions>
condition := condition[1] != 1 and longErule ? 1 :
condition[1] != -1 and shortErule ? -1 :
condition[1] != 0 and longXrule ? 0 :
condition[1] != 0 and shortXrule ? 0 : nz(condition[1])
longE = condition[1] != 1 and condition == 1
shortE = condition[1] != -1 and condition == -1
longX = condition[1] == 1 and longXrule
shortX = condition[1] == -1 and shortXrule
// <color>
c_range = dcRange or condition == 0
c_dcTop = c_range ? color.new(color.gray, 75) :
condition == 1 ? color.new(color.green, 0) :
condition == 0 ? color.new(color.orange, 0) :
dcRange ? color.new(color.orange, 0) :
color.new(color.gray, 75)
c_dcBot = c_range ? color.new(color.gray, 75) :
condition == -1 ? color.new(color.red, 0) :
condition == 0 ? color.new(color.orange, 0) :
color.new(color.gray, 75)
c_dcBasis = dcRange ? color.new(color.orange, 0) :
dc == 1 ? color.new(color.green, 25) :
dc == -1 ? color.new(color.red, 25) : na
c_dcFill = dcRange ? color.new(color.orange, 80) :
dc == 1 ? color.new(color.green, 80) :
dc == -1 ? color.new(color.red, 80) : na
c_barCol = c_range and open <= close ? color.new(color.orange, 0) :
c_range and open > close ? color.new(color.yellow, 0) :
condition == 1 and open <= close ? color.new(C_GREEN, 0) :
condition == 1 and open > close ? color.new(color.green, 0) :
condition == -1 and open >= close ? color.new(C_RED, 0) :
condition == -1 and open < close ? color.new(color.red, 0) :
color.new(color.gray, 0)
//#endregion }
//#region <visuals> {
plot(
i_showBasis ? dcBasis : na,
title = 'Basis',
linewidth = 2,
color = c_dcBasis)
barcolor(i_showBarCol ? c_barCol : na)
//#endregion }
///////////////////////////////////
//version=5
// Define input variables
emaLength = input.int(5, minval=1, title='EMA Length')
rsiLength = input.int(14, minval=1, title='RSI Length')
rsiOverbought = input(80, title='RSI Overbought Level')
rsiOversold = input(20, title='RSI Oversold Level')
start = input.float(title='Start', step=0.001, defval=0.05)
increment = input.float(title='Increment', step=0.001, defval=0.075)
maximum = input.float(title='Maximum', step=0.01, defval=0.35)
width = input.int(title='Point Width', minval=1, defval=2)
psar = ta.sar(start, increment, maximum)
dir = psar < close ? 1 : -1
psarColor = dir == 1 ? #3388bb : #fdcc02
//psarPlot = plot(psar, title='PSAR', style=plot.style_circles, linewidth=width, color=color.new(psarColor,0))
// Calculate EMA
emaValue = ta.ema(close, emaLength)
// Calculate RSI
rsiValue = ta.rsi(close, rsiLength)
// Define variables
var bool strongLongSignal = false
var bool strongShortSignal = false
highlightState = input(title='Highlight State ?', defval=true)
src = input(close, title='Source')
// Plotting
//plot(rsiValue, title='RSI', color=color.new(color.red, 0))
// Determine long and short signals based on conditions
strongLongSignal := high[1] < emaValue[1] and high > high[1] and rsiValue > rsiOversold and rsiValue > rsiValue[1]
longSignal = strongLongSignal
strongShortSignal := low[1] > emaValue[1] and low < low[1] and rsiValue < rsiOverbought and rsiValue < rsiValue[1]
shortSignal = strongShortSignal
// Buy Signal as per PSR
buySignalPSR = dir == 1 and dir[1] == -1
sellSignalPSR = dir == -1 and dir[1] == 1
//5-8-13 Signal
len5 = input.int(5, minval=1, title='5EMA')
out5 = ta.ema(src, len5)
emaValue5 = ta.ema(close, len5)
len8 = input.int(8, minval=1, title='8EMA')
out8 = ta.ema(src, len8)
emaValue8 = ta.ema(close, len8)
len13 = input.int(13, minval=1, title='13EMA')
out13 = ta.ema(src, len13)
emaValue13 = ta.ema(close, len13)
//Plot 5-8-13 EMA on Chart
//plot(out5, title='EMA5', color=color.new(color.red, 0), linewidth=1)
//plot(out8, title='EMA8', color=color.new(color.blue, 0), linewidth=1)
//plot(out13, title='EMA13', color=color.new(color.green, 0), linewidth=1)
// 5-8-13 EMA Buy Sell Signals Calculation
long5813 = ((ta.crossover(emaValue5, emaValue8) or emaValue5 > emaValue8) and
(ta.crossover(emaValue5, emaValue13) or emaValue5 > emaValue13) and
(buySignalPSR or dir == 1) and close > close[1] and
close > emaValue5 and close > emaValue8 and close > emaValue13)
short5813 = (((ta.crossunder(emaValue5, emaValue8) or emaValue5 < emaValue8) and
(ta.crossunder(emaValue5, emaValue13) or emaValue5 < emaValue13)) and
(sellSignalPSR or dir == -1) and close < close[1] and
close < emaValue5 and close < emaValue8 and close < emaValue13)
//Recheck Quick Buy and Sell Signals before plotting
if short5813
longSignal := false
if long5813
shortSignal := false
// Plot long and short signals
plotshape(not longSignal[1] ? longSignal : na, color=color.new(color.green, 0), style=shape.arrowup, text='QB', title='Quick Buy', location=location.belowbar)
plotshape(not long5813[1] ? long5813 : na, title='Strong Buy', color=color.new(color.green, 0), style=shape.triangleup, text='SB',location =location.belowbar)
plotshape(not shortSignal[1] ? shortSignal : na, color=color.new(color.red, 0), style=shape.arrowdown, text='QS',title='Quick Sell', location=location.abovebar, textcolor=color.new(color.red,0))
plotshape(not short5813[1] ? short5813 : na, title='Strong Sell', color=color.new(color.red, 0), style=shape.triangledown, text='SS', location=location.abovebar,textcolor=color.new(color.red,0))
midPricePlot = plot(ohlc4, title='PSAR Plot', display=display.none)
fillColor = highlightState ? dir == 1 ? color.green : color.red : na
//fill(midPricePlot, psarPlot, title='Trade State Filling', color=color.new(fillColor,90))
alertcondition(not longSignal[1] ? longSignal : na, 'Scalp Buy Signal', 'Scalp Buy/Long')
alertcondition(not long5813[1] ? long5813 : na, 'Strong Buy Signal', 'Buy/Long')
alertcondition(not shortSignal[1] ? shortSignal : na, 'Scalp Sell Signal', 'Scalp Sell/Short')
alertcondition(not short5813[1] ? short5813 : na, 'Strong Sell Signal', 'Sell/Short')
//////////////////////////
//@version=5
// ----- * ----- // ----- * ----- // ----- * ----- // ----- * ----- P A R A M E T E R S - S E T U P ----- * ----- // ----- * ----- // ----- * ----- // ----- * -----
// EMA & ATR
float ema_16 = math.round_to_mintick(ta.ema(close, 16))
float ema_64 = math.round_to_mintick(ta.ema(close, 64))
float ema_256 = math.round_to_mintick(ta.ema(close, 256))
float atr = ta.atr(16)
bool golden_cross = ta.crossover(ema_64, ema_256)
bool death_cross = ta.crossunder(ema_64, ema_256)
bool bullish_64 = ema_16 > ema_64
bool bearish_64 = ema_16 < ema_64
bool bullish_256 = ema_64 > ema_256
bool bearish_256 = ema_64 < ema_256
color trend_color_64 = bullish_64 ? color.new(#00E676, 50) : color.new(#FF5252, 50)
color trend_color_256 = bullish_256 ? color.new(#00E676, 10) : color.new(#FF5252, 10)
// ----- * ----- // ----- * ----- // ----- * ----- // ----- * ----- T R A D I N G - S E T U P ----- * ----- // ----- * ----- // ----- * ----- // ----- * -----
// Accumulation zone
float upper_atr = ema_16 + atr
float lower_atr = ema_16 - atr
bool in_trend = (hl2 > upper_atr or hl2 < lower_atr) or (ema_64 > upper_atr or ema_64 < lower_atr)
ub = plot(in_trend ? na : upper_atr, "Upper Band", color = color.new(#FF5252, 100), editable = false, offset = 0, display = display.none)
lb = plot(in_trend ? na : lower_atr, "Lower Band", color = color.new(#FF5252, 100), editable = false, offset = 0, display = display.none)
//fill(ub, lb, title = "Accumulation Zone", color = color.new(#FF5252, 25), display = display.none)
// Long & short conditions
bool long_conditions = bullish_64 and bullish_256 //and in_trend (to be developed)
bool short_conditions = bearish_64 and bearish_256 //and in_trend (to be developed)
bool trigger_l_64 = (ta.crossunder(low, ema_64) or open < ema_64) and (close > ema_64) and long_conditions
bool trigger_l_256 = (ta.crossunder(low, ema_256) or low == ema_256 or open < ema_256) and (close > ema_256) and bullish_256
bool trigger_s_64 = (ta.crossover(high, ema_64) or high == ema_64) and (close < ema_64) and short_conditions
bool trigger_s_256 = (ta.crossover(high, ema_256) or high == ema_256) and (close < ema_256) and bearish_256
// Execution check long
x = ta.barssince(golden_cross)
bool executed_l_64 = false
i = 1
while not executed_l_64 and i < x
if (trigger_l_64[i]) or (close[i] < ema_64)
executed_l_64 := true
else
i := i + 1
bool executed_l_256 = false
j = 1
while not executed_l_256 and j < x
if trigger_l_256[j]
executed_l_256 := true
else
j := j + 1
// Execution check short
y = ta.barssince(death_cross)
bool executed_s_64 = false
k = 1
while not executed_s_64 and k < y
if (trigger_s_64[k]) or (close[k] > ema_64)
executed_s_64 := true
else
k := k + 1
bool executed_s_256 = false
l = 1
while not executed_s_256 and l < y
if trigger_s_256[l]
executed_s_256 := true
else
l := l + 1
// Position opening & SL
bool long_64 = trigger_l_64 and (executed_l_64 == false)
bool long_256 = trigger_l_256 and (executed_l_256 == false)
bool short_64 = trigger_s_64 and (executed_s_64 == false)
bool short_256 = trigger_s_256 and (executed_s_256 == false)
float entry = close[1]
float sl_long = low[1] * .995
float sl_short = high[1] * 1.005
//float lowest_low = ta.lowest(math.max(nz(x), 1)) // Support to be developed
//float highest_high = ta.highest(math.max(nz(y), 1)) // Resistance to be developed
// ----- * ----- // ----- * ----- // ----- * ----- // ----- * ----- P L O T ----- * ----- // ----- * ----- // ----- * ----- // ----- * -----
float ema_64_pips = math.round_to_mintick(math.abs(close - ema_64[1]))
float ema_64_percent = math.round_to_mintick(close / ema_64[1] - 1) * 100
float ema_256_pips = math.round_to_mintick(math.abs(close - ema_256[1]))
float ema_256_percent = math.round_to_mintick(close / ema_256[1] - 1) * 100
//plot(ema_16, "EMA 16", color = color.new(#FF9800, 0), linewidth = 1, display = display.none)
plot(ema_64, "EMA 64", color = trend_color_64, linewidth = 2, display = display.none)
//plot(ema_256, "EMA 256", color = trend_color_256, linewidth = 3, display = display.all)
https://tr.tradingview.com/v/iwEyBE2d/
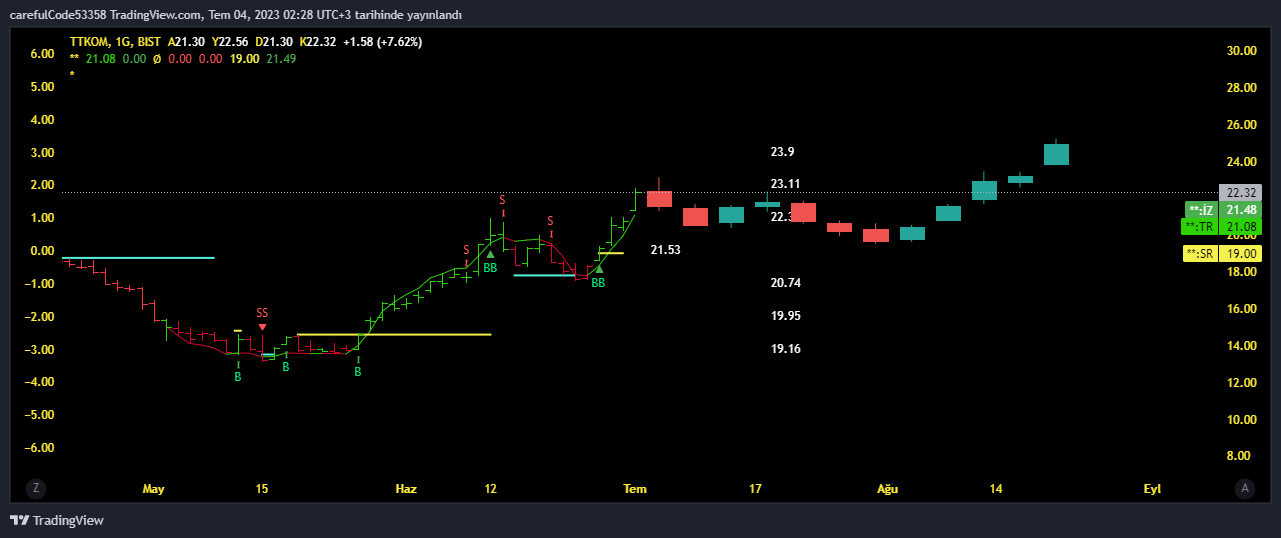
görüntü.... https://www.tradingview.com/x/BDyCfDDw/
PHP Code:
// This source code is subject to these terms:
// Attribution-NonCommercial 4.0 International (CC BY-NC 4.0)
// https://creativecommons.org/licenses/by-nc/4.0/
// You are free to Share, copy and redistribute. Adapt, transform and re-build on this script.
// Under the following terms: Non-commercial & Attribution.
// © gu5tavo71 (Gustavo Cardelle)
//@version=5
VERSION = 'v1.4.42'
indicator(
'Donchian Channels [Gu5]',
shorttitle = 'DC ' + VERSION,
overlay = true,
explicit_plot_zorder = true,
max_bars_back = 5000)
// Donchian Channels developed by Richard Donchian
// Actual Study Version: @gu5tavo71
// 2023.05.12
// Project #687
// This script reuses open source code from another authors:
// @PineCoders, Built-in Library, and Community Scripts
// Disclaimer: I am not a financial advisor.
// For purpose educate only. Use at your own risk.
//#region <constant_declarations> {
//<my colors>
C_GREEN = #006400 //Green
C_GREENLIGHT = #388e3c //Green Light
C_RED = #8B0000 //Red
C_REDLIGHT = #b71c1c //Red Light
//#endregion }
//#region <inputs> {
i_dcLen = input.int (20, 'Length' , minval = 1)
//Display
G_DISPLAY = 'Display'
i_showBasis = input.bool (true, '■ Basis On/Off' , group = G_DISPLAY)
i_alertOn = input.bool (false, '■ Alert On/Off' , group = G_DISPLAY)
i_showFill = input.bool (false, '■ Fill On/Off' , group = G_DISPLAY)
i_showBarCol = input.bool (true, '■ Bar Color On/Off' , group = G_DISPLAY)
i_showClose = input.bool (false, '■ Close Alert On/Off' , group = G_DISPLAY)
//#endregion }
//#region <calculations> {
//<set initial values>
condition = 0.0
dc = 0.0
dcDirCond = 0.0
dcTopDir = 0.0
dcBotDir = 0.0
dcTop = ta.highest(i_dcLen)
dcBot = ta.lowest (i_dcLen)
dcBasis = math.avg(dcTop, dcBot)
dc := dc[1] != 1 and dcTop > dcTop[1] ? 1 :
dc[1] != -1 and dcBot < dcBot[1] ? -1 : nz(dc[1])
dcDirUp = dcTop > dcTop[1]
dcDirDn = dcBot < dcBot[1]
dcDirZero = ta.crossunder(close, dcBasis) or ta.crossover(close, dcBasis)
dcDirCond := dcDirCond[1] != 1 and dcDirUp ? 1 :
dcDirCond[1] != -1 and dcDirDn ? -1 :
dcDirCond[1] != 0 and dcDirZero ? 0 : nz(dcDirCond[1])
dcDir = dcDirCond == 0 ? 0 :
dc == 1 ? 1 : -1
dcTopDir := dcTop < dcTop[1] ? 0 :
dcTop > dcTop[1] ? 1 : nz(dcTopDir[1])
dcBotDir := dcBot > dcBot[1] ? 0 :
dcBot < dcBot[1] ? -1 : nz(dcBotDir[1])
dcRange = dcTopDir == 0 and dcBotDir == 0
//<rules>
longErule = dcTop > dcTop[1]
shortErule = dcBot < dcBot[1]
longXrule = i_showClose ? ta.crossunder(close, dcBasis) : false
shortXrule = i_showClose ? ta.crossover (close, dcBasis) : false
//<conditions>
condition := condition[1] != 1 and longErule ? 1 :
condition[1] != -1 and shortErule ? -1 :
condition[1] != 0 and longXrule ? 0 :
condition[1] != 0 and shortXrule ? 0 : nz(condition[1])
longE = condition[1] != 1 and condition == 1
shortE = condition[1] != -1 and condition == -1
longX = condition[1] == 1 and longXrule
shortX = condition[1] == -1 and shortXrule
// <color>
c_range = dcRange or condition == 0
c_dcTop = c_range ? color.new(color.gray, 75) :
condition == 1 ? color.new(color.green, 0) :
condition == 0 ? color.new(color.orange, 0) :
dcRange ? color.new(color.orange, 0) :
color.new(color.gray, 75)
c_dcBot = c_range ? color.new(color.gray, 75) :
condition == -1 ? color.new(color.red, 0) :
condition == 0 ? color.new(color.orange, 0) :
color.new(color.gray, 75)
c_dcBasis = dcRange ? color.new(color.orange, 0) :
dc == 1 ? color.new(color.green, 25) :
dc == -1 ? color.new(color.red, 25) : na
c_dcFill = dcRange ? color.new(color.orange, 80) :
dc == 1 ? color.new(color.green, 80) :
dc == -1 ? color.new(color.red, 80) : na
c_barCol = c_range and open <= close ? color.new(color.orange, 0) :
c_range and open > close ? color.new(color.yellow, 0) :
condition == 1 and open <= close ? color.new(C_GREEN, 0) :
condition == 1 and open > close ? color.new(color.green, 0) :
condition == -1 and open >= close ? color.new(C_RED, 0) :
condition == -1 and open < close ? color.new(color.red, 0) :
color.new(color.gray, 0)
//#endregion }
//#region <visuals> {
plot(
i_showBasis ? dcBasis : na,
title = 'Basis',
linewidth = 2,
color = c_dcBasis)
barcolor(i_showBarCol ? c_barCol : na)
//#endregion }
///////////////////////////////////
//version=5
// Define input variables
emaLength = input.int(5, minval=1, title='EMA Length')
rsiLength = input.int(14, minval=1, title='RSI Length')
rsiOverbought = input(80, title='RSI Overbought Level')
rsiOversold = input(20, title='RSI Oversold Level')
start = input.float(title='Start', step=0.001, defval=0.05)
increment = input.float(title='Increment', step=0.001, defval=0.075)
maximum = input.float(title='Maximum', step=0.01, defval=0.35)
width = input.int(title='Point Width', minval=1, defval=2)
psar = ta.sar(start, increment, maximum)
dir = psar < close ? 1 : -1
psarColor = dir == 1 ? #3388bb : #fdcc02
//psarPlot = plot(psar, title='PSAR', style=plot.style_circles, linewidth=width, color=color.new(psarColor,0))
// Calculate EMA
emaValue = ta.ema(close, emaLength)
// Calculate RSI
rsiValue = ta.rsi(close, rsiLength)
// Define variables
var bool strongLongSignal = false
var bool strongShortSignal = false
highlightState = input(title='Highlight State ?', defval=true)
src = input(close, title='Source')
// Plotting
//plot(rsiValue, title='RSI', color=color.new(color.red, 0))
// Determine long and short signals based on conditions
strongLongSignal := high[1] < emaValue[1] and high > high[1] and rsiValue > rsiOversold and rsiValue > rsiValue[1]
longSignal = strongLongSignal
strongShortSignal := low[1] > emaValue[1] and low < low[1] and rsiValue < rsiOverbought and rsiValue < rsiValue[1]
shortSignal = strongShortSignal
// Buy Signal as per PSR
buySignalPSR = dir == 1 and dir[1] == -1
sellSignalPSR = dir == -1 and dir[1] == 1
//5-8-13 Signal
len5 = input.int(5, minval=1, title='5EMA')
out5 = ta.ema(src, len5)
emaValue5 = ta.ema(close, len5)
len8 = input.int(8, minval=1, title='8EMA')
out8 = ta.ema(src, len8)
emaValue8 = ta.ema(close, len8)
len13 = input.int(13, minval=1, title='13EMA')
out13 = ta.ema(src, len13)
emaValue13 = ta.ema(close, len13)
//Plot 5-8-13 EMA on Chart
//plot(out5, title='EMA5', color=color.new(color.red, 0), linewidth=1)
//plot(out8, title='EMA8', color=color.new(color.blue, 0), linewidth=1)
//plot(out13, title='EMA13', color=color.new(color.green, 0), linewidth=1)
// 5-8-13 EMA Buy Sell Signals Calculation
long5813 = ((ta.crossover(emaValue5, emaValue8) or emaValue5 > emaValue8) and
(ta.crossover(emaValue5, emaValue13) or emaValue5 > emaValue13) and
(buySignalPSR or dir == 1) and close > close[1] and
close > emaValue5 and close > emaValue8 and close > emaValue13)
short5813 = (((ta.crossunder(emaValue5, emaValue8) or emaValue5 < emaValue8) and
(ta.crossunder(emaValue5, emaValue13) or emaValue5 < emaValue13)) and
(sellSignalPSR or dir == -1) and close < close[1] and
close < emaValue5 and close < emaValue8 and close < emaValue13)
//Recheck Quick Buy and Sell Signals before plotting
if short5813
longSignal := false
if long5813
shortSignal := false
// Plot long and short signals
//plotshape(not longSignal[1] ? longSignal : na, color=color.new(color.green, 0), style=shape.arrowup, text='QB', title='Quick Buy', location=location.belowbar)
//plotshape(not long5813[1] ? long5813 : na, title='Strong Buy', color=color.new(color.green, 0), style=shape.triangleup, text='SB',location =location.belowbar)
//plotshape(not shortSignal[1] ? shortSignal : na, color=color.new(color.red, 0), style=shape.arrowdown, text='QS',title='Quick Sell', location=location.abovebar, textcolor=color.new(color.red,0))
//plotshape(not short5813[1] ? short5813 : na, title='Strong Sell', color=color.new(color.red, 0), style=shape.triangledown, text='SS', location=location.abovebar,textcolor=color.new(color.red,0))
midPricePlot = plot(ohlc4, title='PSAR Plot', display=display.none)
fillColor = highlightState ? dir == 1 ? color.green : color.red : na
//fill(midPricePlot, psarPlot, title='Trade State Filling', color=color.new(fillColor,90))
alertcondition(not longSignal[1] ? longSignal : na, 'Scalp Buy Signal', 'Scalp Buy/Long')
alertcondition(not long5813[1] ? long5813 : na, 'Strong Buy Signal', 'Buy/Long')
alertcondition(not shortSignal[1] ? shortSignal : na, 'Scalp Sell Signal', 'Scalp Sell/Short')
alertcondition(not short5813[1] ? short5813 : na, 'Strong Sell Signal', 'Sell/Short')
//////////////////////////
// This source code is subject to the terms of the Mozilla Public License 2.0 at https://mozilla.org/MPL/2.0/
// © ChartPrime
//@version=5
// Custom cosh function
cosh(float x) =>
(math.exp(x) + math.exp(-x)) / 2
// Custom acosh function
acosh(float x) =>
x < 1 ? na : math.log(x + math.sqrt(x * x - 1))
// Custom sinh function
sinh(float x) =>
(math.exp(x) - math.exp(-x)) / 2
// Custom asinh function
asinh(float x) =>
math.log(x + math.sqrt(x * x + 1))
// Custom inverse tangent function
atan(float x) =>
math.pi / 2 - math.atan(1 / x)
// Chebyshev Type I Moving Average
chebyshevI(float src, int len, float ripple) =>
a = 0.
b = 0.
g = 0.
chebyshev = 0.
a := cosh(1 / len * acosh(1 / (1 - ripple)))
b := sinh(1 / len * asinh(1 / ripple))
g := (a - b) / (a + b)
chebyshev := (1 - g) * src + g * nz(chebyshev[1])
chebyshev
bool_to_float(bool source) =>
source ? 1 : 0
ema(source)=>
var float ema = 0.0
var int count = 0
count := nz(count[1]) + 1
ema := (1.0 - 2.0 / (count + 1.0)) * nz(ema[1]) + 2.0 / (count + 1.0) * source
ema
atan2(y, x) =>
var float angle = 0.0
if x > 0
angle := math.atan(y / x)
else
if x < 0 and y >= 0
angle := math.atan(y / x) + math.pi
else
if x < 0 and y < 0
angle := math.atan(y / x) - math.pi
else
if x == 0 and y > 0
angle := math.pi / 2
else
if x == 0 and y < 0
angle := -math.pi / 2
angle
degrees(float source) =>
source * 180 / math.pi
tra()=>
atr = ema(ta.tr)
slope = (close - close[10]) / (atr * 10)
angle_rad = atan2(slope, 1)
degrees = degrees(angle_rad)
source = ta.sma((degrees > 0 ? high : low), 2)
mats(source, length) =>
smooth = 0.
higher_high = math.max(math.sign(ta.change(ta.highest(length))), 0)
lower_low = math.max(math.sign(ta.change(ta.lowest(length)) * -1), 0)
time_constant = math.pow(ta.sma(bool_to_float(higher_high or lower_low), length), 2)
smooth := nz(smooth[1] + time_constant * (source - smooth[1]), source)
wilders_period = length * 4 - 1
atr = math.abs(nz(smooth[1]) - smooth)
ma_atr = ta.ema(atr, wilders_period)
delta_fast_atr = ta.ema(ma_atr, wilders_period) * length * 0.4
result = 0.0
if smooth > nz(result[1])
if smooth - delta_fast_atr < result[1]
result := result[1]
else
result := smooth - delta_fast_atr
else
if smooth + delta_fast_atr > result[1]
result := result[1]
else
result := smooth + delta_fast_atr
// Return
result
length = input.int(20, "Length", 2)
up_color = input.color(color.blue, "", inline = "color")
down_color = input.color(color.orange, "", inline = "color")
enable_glow = input.bool(true, "Enable Glow", inline = "color")
mats = mats(tra(), length)
atr = ta.atr(length)
colour = ta.sma(close, 2) > mats ? up_color : down_color
atr_10 = ema(ta.tr) / 2
alpha = color.new(color.black, 100)
max = mats + atr_10
min = mats - atr_10
center = plot(mats, "Moving Average Trend Sniper", colour, editable = true)
//plot(mats, "Moving Average Trend Sniper", color.new(colour, 70), 2, editable = true)
//plot(mats, "Moving Average Trend Sniper", color.new(colour, 80), 3, editable = true)
//plot(mats, "Moving Average Trend Sniper", color.new(colour, 90), 4, editable = true)
//top = plot(enable_glow ? max : na, "Moving Average Trend Sniper", alpha)
//bottom = plot(enable_glow ? min : na, "Moving Average Trend Sniper", alpha)
//fill(top, center, top_value = max, bottom_value = mats, bottom_color = color.new(colour, 75), top_color = alpha, editable = true)
//fill(center, bottom, top_value = mats, bottom_value = min, bottom_color = alpha, top_color = color.new(colour, 75), editable = true)
https://tr.tradingview.com/v/pFV6T1r2/
görüntü.... https://www.tradingview.com/x/xiNNJnwC/
PHP Code:
// This source code is subject to these terms:
// Attribution-NonCommercial 4.0 International (CC BY-NC 4.0)
// https://creativecommons.org/licenses/by-nc/4.0/
// You are free to Share, copy and redistribute. Adapt, transform and re-build on this script.
// Under the following terms: Non-commercial & Attribution.
// © gu5tavo71 (Gustavo Cardelle)
//@version=5
VERSION = 'v1.4.42'
indicator(
'Donchian Channels [Gu5]',
shorttitle = 'DC ' + VERSION,
overlay = true,
explicit_plot_zorder = true,
max_bars_back = 5000)
// Donchian Channels developed by Richard Donchian
// Actual Study Version: @gu5tavo71
// 2023.05.12
// Project #687
// This script reuses open source code from another authors:
// @PineCoders, Built-in Library, and Community Scripts
// Disclaimer: I am not a financial advisor.
// For purpose educate only. Use at your own risk.
//#region <constant_declarations> {
//<my colors>
C_GREEN = #006400 //Green
C_GREENLIGHT = #388e3c //Green Light
C_RED = #8B0000 //Red
C_REDLIGHT = #b71c1c //Red Light
//#endregion }
//#region <inputs> {
i_dcLen = input.int (20, 'Length' , minval = 1)
//Display
G_DISPLAY = 'Display'
i_showBasis = input.bool (true, '■ Basis On/Off' , group = G_DISPLAY)
//i_alertOn = input.bool (false, '■ Alert On/Off' , group = G_DISPLAY)
//i_showFill = input.bool (false, '■ Fill On/Off' , group = G_DISPLAY)
i_showBarCol = input.bool (true, '■ Bar Color On/Off' , group = G_DISPLAY)
i_showClose = input.bool (false, '■ Close Alert On/Off' , group = G_DISPLAY)
//#endregion }
//#region <calculations> {
//<set initial values>
condition = 0.0
dc = 0.0
dcDirCond = 0.0
dcTopDir = 0.0
dcBotDir = 0.0
dcTop = ta.highest(i_dcLen)
dcBot = ta.lowest (i_dcLen)
dcBasis = math.avg(dcTop, dcBot)
dc := dc[1] != 1 and dcTop > dcTop[1] ? 1 :
dc[1] != -1 and dcBot < dcBot[1] ? -1 : nz(dc[1])
dcDirUp = dcTop > dcTop[1]
dcDirDn = dcBot < dcBot[1]
dcDirZero = ta.crossunder(close, dcBasis) or ta.crossover(close, dcBasis)
dcDirCond := dcDirCond[1] != 1 and dcDirUp ? 1 :
dcDirCond[1] != -1 and dcDirDn ? -1 :
dcDirCond[1] != 0 and dcDirZero ? 0 : nz(dcDirCond[1])
dcDir = dcDirCond == 0 ? 0 :
dc == 1 ? 1 : -1
dcTopDir := dcTop < dcTop[1] ? 0 :
dcTop > dcTop[1] ? 1 : nz(dcTopDir[1])
dcBotDir := dcBot > dcBot[1] ? 0 :
dcBot < dcBot[1] ? -1 : nz(dcBotDir[1])
dcRange = dcTopDir == 0 and dcBotDir == 0
//<rules>
longErule = dcTop > dcTop[1]
shortErule = dcBot < dcBot[1]
longXrule = i_showClose ? ta.crossunder(close, dcBasis) : false
shortXrule = i_showClose ? ta.crossover (close, dcBasis) : false
//<conditions>
condition := condition[1] != 1 and longErule ? 1 :
condition[1] != -1 and shortErule ? -1 :
condition[1] != 0 and longXrule ? 0 :
condition[1] != 0 and shortXrule ? 0 : nz(condition[1])
longE = condition[1] != 1 and condition == 1
shortE = condition[1] != -1 and condition == -1
longX = condition[1] == 1 and longXrule
shortX = condition[1] == -1 and shortXrule
// <color>
c_range = dcRange or condition == 0
c_dcTop = c_range ? color.new(color.gray, 75) :
condition == 1 ? color.new(color.green, 0) :
condition == 0 ? color.new(color.orange, 0) :
dcRange ? color.new(color.orange, 0) :
color.new(color.gray, 75)
c_dcBot = c_range ? color.new(color.gray, 75) :
condition == -1 ? color.new(color.red, 0) :
condition == 0 ? color.new(color.orange, 0) :
color.new(color.gray, 75)
c_dcBasis = dcRange ? color.new(color.orange, 0) :
dc == 1 ? color.new(color.green, 25) :
dc == -1 ? color.new(color.red, 25) : na
c_dcFill = dcRange ? color.new(color.orange, 80) :
dc == 1 ? color.new(color.green, 80) :
dc == -1 ? color.new(color.red, 80) : na
c_barCol = c_range and open <= close ? color.new(color.orange, 0) :
c_range and open > close ? color.new(color.yellow, 0) :
condition == 1 and open <= close ? color.new(C_GREEN, 0) :
condition == 1 and open > close ? color.new(color.green, 0) :
condition == -1 and open >= close ? color.new(C_RED, 0) :
condition == -1 and open < close ? color.new(color.red, 0) :
color.new(color.gray, 0)
//#endregion }
//#region <visuals> {
plot(
i_showBasis ? dcBasis : na,
title = 'Basis',
linewidth = 2,
color = c_dcBasis)
barcolor(i_showBarCol ? c_barCol : na)
//#endregion }
// This source code is subject to the terms of the Mozilla Public License 2.0 at https://mozilla.org/MPL/2.0/
// © ChartPrime
//@version=5
// Custom cosh function
cosh(float x) =>
(math.exp(x) + math.exp(-x)) / 2
// Custom acosh function
acosh(float x) =>
x < 1 ? na : math.log(x + math.sqrt(x * x - 1))
// Custom sinh function
sinh(float x) =>
(math.exp(x) - math.exp(-x)) / 2
// Custom asinh function
asinh(float x) =>
math.log(x + math.sqrt(x * x + 1))
// Custom inverse tangent function
atan(float x) =>
math.pi / 2 - math.atan(1 / x)
// Chebyshev Type I Moving Average
chebyshevI(float src, int len, float ripple) =>
a = 0.
b = 0.
g = 0.
chebyshev = 0.
a := cosh(1 / len * acosh(1 / (1 - ripple)))
b := sinh(1 / len * asinh(1 / ripple))
g := (a - b) / (a + b)
chebyshev := (1 - g) * src + g * nz(chebyshev[1])
chebyshev
bool_to_float(bool source) =>
source ? 1 : 0
ema(source)=>
var float ema = 0.0
var int count = 0
count := nz(count[1]) + 1
ema := (1.0 - 2.0 / (count + 1.0)) * nz(ema[1]) + 2.0 / (count + 1.0) * source
ema
atan2(y, x) =>
var float angle = 0.0
if x > 0
angle := math.atan(y / x)
else
if x < 0 and y >= 0
angle := math.atan(y / x) + math.pi
else
if x < 0 and y < 0
angle := math.atan(y / x) - math.pi
else
if x == 0 and y > 0
angle := math.pi / 2
else
if x == 0 and y < 0
angle := -math.pi / 2
angle
degrees(float source) =>
source * 180 / math.pi
tra()=>
atr = ema(ta.tr)
slope = (close - close[10]) / (atr * 10)
angle_rad = atan2(slope, 1)
degrees = degrees(angle_rad)
source = ta.sma((degrees > 0 ? high : low), 2)
mats(source, length) =>
smooth = 0.
higher_high = math.max(math.sign(ta.change(ta.highest(length))), 0)
lower_low = math.max(math.sign(ta.change(ta.lowest(length)) * -1), 0)
time_constant = math.pow(ta.sma(bool_to_float(higher_high or lower_low), length), 2)
smooth := nz(smooth[1] + time_constant * (source - smooth[1]), source)
wilders_period = length * 4 - 1
atr = math.abs(nz(smooth[1]) - smooth)
ma_atr = ta.ema(atr, wilders_period)
delta_fast_atr = ta.ema(ma_atr, wilders_period) * length * 0.4
result = 0.0
if smooth > nz(result[1])
if smooth - delta_fast_atr < result[1]
result := result[1]
else
result := smooth - delta_fast_atr
else
if smooth + delta_fast_atr > result[1]
result := result[1]
else
result := smooth + delta_fast_atr
// Return
result
length = input.int(20, "Length", 2)
up_color = input.color(color.blue, "", inline = "color")
down_color = input.color(color.orange, "", inline = "color")
enable_glow = input.bool(true, "Enable Glow", inline = "color")
mats = mats(tra(), length)
atr = ta.atr(length)
colour = ta.sma(close, 2) > mats ? up_color : down_color
atr_10 = ema(ta.tr) / 2
alpha = color.new(color.black, 100)
max = mats + atr_10
min = mats - atr_10
center = plot(mats, "Moving Average Trend Sniper", colour, editable = true)
// This source code is subject to the terms of the Mozilla Public License 2.0 at https://mozilla.org/MPL/2.0/
// © jjustingreyy
//@version=5
// Input settings
atrLength = input(3, title="ATR Length")
thresholdMultiplier = input(1.5, title="Threshold Multiplier")
HTF = input.timeframe('', 'TimeFrame')
// Get data from the higher timeframe
[h_high, h_low, h_close] = request.security(syminfo.tickerid, HTF, [high, low, close])
// Calculate True Range and Average True Range
trueRange = math.max(math.max(h_high - h_low, math.abs(h_high - h_close[1])), math.abs(h_low - h_close[1]))
atr33 = ta.sma(trueRange, atrLength)
threshold = atr33 * thresholdMultiplier
// Determine if it's a high volatility candle
isHighVolatility = h_close > h_close[1] + threshold
// Line settings
last = input(5, 'Display last X lines')
lineLevel = isHighVolatility ? (h_close[1] > h_close ? h_high : h_low) : na
// Line management variables
var line[] mylines = array.new_line(0)
var bool[] mylinestyles = array.new_bool(0) // Store initial styles
var int[] crossCount = array.new_int(0) // Store cross counts
var float prevLineLevel = na
var int prevBarIndex = na
var bool prevState = na
// Draw trendlines
if isHighVolatility
if not na(prevLineLevel)
// Determine the initial color and style based on price action
initialColor = close[1] > lineLevel ? color.rgb(108, 240, 126) : color.red
initialStyle = close[1] > lineLevel ? line.style_solid : line.style_solid
// Create the new line and add it to the array
lineId = line.new(x1=prevBarIndex, y1=prevLineLevel, x2=bar_index[0], y2=lineLevel, xloc=xloc.bar_index, style=initialStyle, extend=array.size(mylines) == last - 1 ? extend.right : extend.none, color=initialColor, width=2)
array.push(mylines, lineId)
array.push(mylinestyles, initialStyle == line.style_solid) // Store the initial style as a boolean (true for solid)
array.push(crossCount, 0) // Initialize cross count for the new line
// Remove lines and associated data beyond the recent X amount of lines
if array.size(mylines) > last
line.delete(array.shift(mylines))
array.shift(mylinestyles)
array.shift(crossCount)
// Update previous line level and bar index
prevLineLevel := lineLevel
prevBarIndex := bar_index[0]
// Check for price crossing the trendline
var line closestLine = na
if array.size(mylines) > 0
closestLine := array.get(mylines, array.size(mylines) - 1)
crossOver = ta.crossover(close, line.get_price(closestLine, bar_index))
crossUnder = ta.crossunder(close, line.get_price(closestLine, bar_index))
// Declare isAboveLine variable
bool isAboveLine = na
// Update the color of the closest trendline based on price action
if array.size(mylines) > 0
isAboveLine := close >= line.get_price(closestLine, bar_index)
if na(prevState)
prevState := isAboveLine
if crossOver or crossUnder
// Increment the cross count
array.set(crossCount, array.size(crossCount) - 1, array.get(crossCount, array.size(crossCount) - 1) + 1)
// Check if the price has crossed the trendline twice
if array.get(crossCount, array.size(crossCount) - 1) >= 2
line.set_style(closestLine, line.style_dashed) // Set line style to dashed when the price crosses a red line
else
line.set_color(closestLine, isAboveLine ? color.rgb(108, 240, 126) : color.rgb(255, 82, 82))
prevState := isAboveLine
// Extend only the current line to the right
for i = 0 to array.size(mylines) - 1
line.set_extend(array.get(mylines, i), i == array.size(mylines) - 1 ? extend.right : extend.none)


Yer İmleri