


son çalışma ve son derleme örneğidir....
normal üyelikle, tradingwievde tek ekran, üç kod olarak düzenlenmiştir....
birinci bölümde birleştirilen kodların birincisi:
yıllık-aylık-haftalık fibanacci değerleri kullanılarak hesaplanan dinamik pivotlardır.
ekranda iki beyaz çizgi olarak kullanılırken...periyot düşürüldüğünde aylık turuncu...haftalık mavi olur....
ikinci kod ise hlc/3 ve 5 gün smoot ile aylık-haftalık-günlük birleşerek dinamik pivotlarla destek-dirençler...
ekranda en sonda çizgi olarak gözüküyor....
üçüncü ise fiyat ihlalinin ortalama şeklinde görülmesi için median ile belirleyerek kapanıştan iz sürme...
ekranda ise gözükmeyen, ? işaretli değer....
dördüncü ise 50 left-5 right pivot tepe ve diplerle alsat belirleyerek, tepe ve diplerle trend çizgileri çektirme....
çizgiler siyah, pivatlar barlarda sarı renkli label olarak....
beşinci ise stokastich momentum ındex hesaplamasının aynı eksende kullanılması....
ekranda çizgiler yok....veriler table olarak....
değerler ve stil ayarları değiştirilebilir....
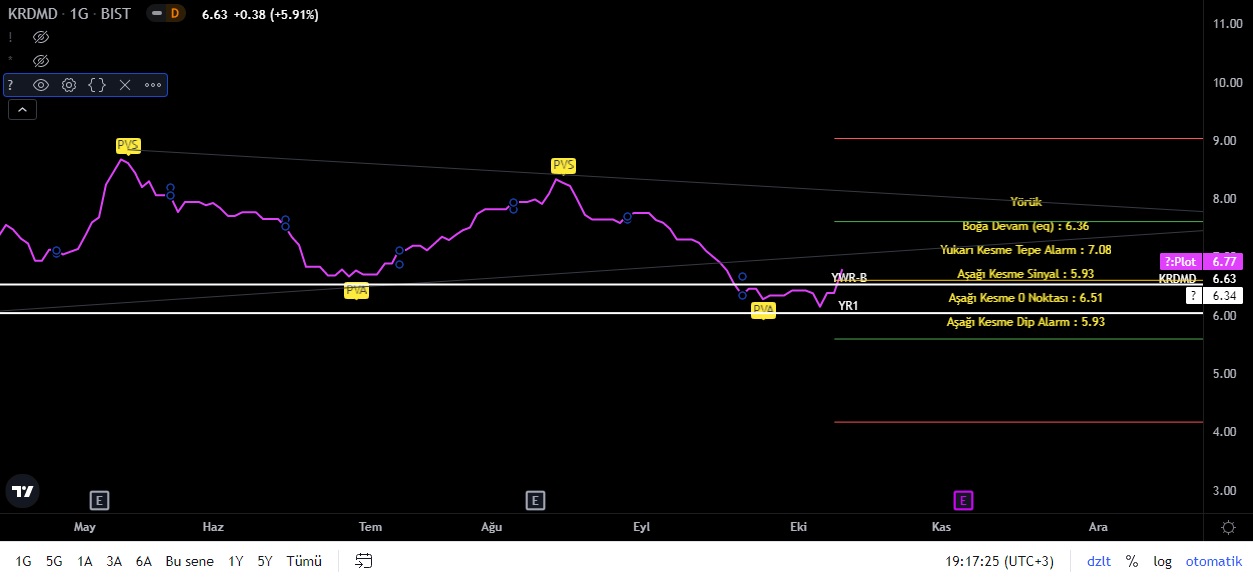
görüntü
günlük
saatlik
birleştirilmiş kod örneği
// This source code is subject to the terms of the Mozilla Public License 2.0 at https://mozilla.org/MPL/2.0/
// © Vallahualem
//@version=4 .................................................. ............................................
study(title="Dinamik Pivotlar", shorttitle="?", overlay=true, format=format.inherit)
//TimeFrame Selections
Year_SR = timeframe.isdaily or timeframe.isintraday
Month_SR = timeframe.period == '3' or timeframe.period == '5' or timeframe.period == '10' or timeframe.period == '15' or timeframe.period == '26' or timeframe.period == '30' or timeframe.period == '60' or timeframe.period == '120'
Week_SR = timeframe.period == '1' or timeframe.period == '3' or timeframe.period == '5' or timeframe.period == '10' or timeframe.period == '15'
//Time Setting for Label Placements
Monthly_SR = timeframe.period == "180" or timeframe.period == "240" or timeframe.period == "300" or timeframe.isdaily
Weekly_SR = timeframe.period == "26" or timeframe.period == "30" or timeframe.period == "60"
Daily_SR = timeframe.period == "1" or timeframe.period == "3"or timeframe.period == "5" or timeframe.period == "10" or timeframe.period == "15"
changePeriod = Daily_SR ? (abs(time("D") - time_close("D"))) / 3 :
Weekly_SR ? (abs(time("W") - time_close("W"))) / 3 :
Monthly_SR ? (abs(time("M") - time_close("M"))) / 3 :
na
start = Daily_SR ? time("D") + changePeriod :
Weekly_SR ? time("W") + changePeriod :
Monthly_SR ? time("M") + changePeriod :
na
//Colors for S/R Lines
yearColor = input(title="Yıllık", type=input.color, defval=color.white)
monthColor = input(title="Aylık", type=input.color, defval=color.orange)
weekColor = input(title="Haftalık", type=input.color, defval=color.blue)
//Style line
// STEP 1. Make the input with pull-down menu
styleOption = input(title="Line Style", type=input.string,
options=["dashed (â)","solid (â)"], defval="solid (â)")
// STEP 2. Convert the input to a proper line style value
lineStyle = (styleOption == "solid (â)") ? line.style_solid :
(styleOption == "dashed (â)") ? line.style_dashed :
line.style_solid
/////////////////////
// Get HLC for Yearly Pivots//
[yphigh, yplow, ypclose] = security(syminfo.tickerid, '12M', [high[1], low[1], close[1]], lookahead = true)
//Yearly Pivot Points
ypivot = (yphigh + yplow + ypclose) / 3
yr7 = ypivot + (yphigh - yplow) * 2.000
yr6 = ypivot + (yphigh - yplow) * 1.618
yr5 = ypivot + (yphigh - yplow) * 1.414
yr4 = ypivot + (yphigh - yplow) * 1.272
yr3 = ypivot + (yphigh - yplow) * 1.000
yrc = ypivot + (yphigh - yplow) * 0.764
yr2 = ypivot + (yphigh - yplow) * 0.618
yrb = ypivot + (yphigh - yplow) * 0.500
yr1 = ypivot + (yphigh - yplow) * 0.382
yra = ypivot + (yphigh - yplow) * 0.236
ysa = ypivot - (yphigh - yplow) * 0.236
ys1 = ypivot - (yphigh - yplow) * 0.382
ysb = ypivot - (yphigh - yplow) * 0.500
ys2 = ypivot - (yphigh - yplow) * 0.618
ysc = ypivot - (yphigh - yplow) * 0.764
ys3 = ypivot - (yphigh - yplow) * 1.000
ys4 = ypivot - (yphigh - yplow) * 1.272
ys5 = ypivot - (yphigh - yplow) * 1.414
ys6 = ypivot - (yphigh - yplow) * 1.618
ys7 = ypivot - (yphigh - yplow) * 2.000
// Get HLC for Monthly Pivots//
[mphigh, mplow, mpclose] = security(syminfo.tickerid, 'M', [high[1], low[1], close[1]], lookahead = true)
//Monthly Pivot Points
mpivot = (mphigh + mplow + mpclose) / 3
mr7 = mpivot + (mphigh - mplow) * 2.000
mr6 = mpivot + (mphigh - mplow) * 1.618
mr5 = mpivot + (mphigh - mplow) * 1.414
mr4 = mpivot + (mphigh - mplow) * 1.272
mr3 = mpivot + (mphigh - mplow) * 1.000
mrc = mpivot + (mphigh - mplow) * 0.764
mr2 = mpivot + (mphigh - mplow) * 0.618
mrb = mpivot + (mphigh - mplow) * 0.500
mr1 = mpivot + (mphigh - mplow) * 0.382
mra = mpivot + (mphigh - mplow) * 0.236
msa = mpivot - (mphigh - mplow) * 0.236
ms1 = mpivot - (mphigh - mplow) * 0.382
msb = mpivot - (mphigh - mplow) * 0.500
ms2 = mpivot - (mphigh - mplow) * 0.618
msc = mpivot - (mphigh - mplow) * 0.764
ms3 = mpivot - (mphigh - mplow) * 1.000
ms4 = mpivot - (mphigh - mplow) * 1.272
ms5 = mpivot - (mphigh - mplow) * 1.414
ms6 = mpivot - (mphigh - mplow) * 1.618
ms7 = mpivot - (mphigh - mplow) * 2.000
// Get HLC for Weekly Pivots//
[wphigh, wplow, wpclose] = security(syminfo.tickerid, 'W', [high[1], low[1], close[1]], lookahead = true)
//Weekly Pivot Points
wpivot = (wphigh + wplow + wpclose) / 3
wr7 = wpivot + (wphigh - wplow) * 2.000
wr6 = wpivot + (wphigh - wplow) * 1.618
wr5 = wpivot + (wphigh - wplow) * 1.414
wr4 = wpivot + (wphigh - wplow) * 1.272
wr3 = wpivot + (wphigh - wplow) * 1.000
wrc = wpivot + (wphigh - wplow) * 0.764
wr2 = wpivot + (wphigh - wplow) * 0.618
wrb = wpivot + (wphigh - wplow) * 0.500
wr1 = wpivot + (wphigh - wplow) * 0.382
wra = wpivot + (wphigh - wplow) * 0.236
wsa = wpivot - (wphigh - wplow) * 0.236
ws1 = wpivot - (wphigh - wplow) * 0.382
wsb = wpivot - (wphigh - wplow) * 0.500
ws2 = wpivot - (wphigh - wplow) * 0.618
wsc = wpivot - (wphigh - wplow) * 0.764
ws3 = wpivot - (wphigh - wplow) * 1.000
ws4 = wpivot - (wphigh - wplow) * 1.272
ws5 = wpivot - (wphigh - wplow) * 1.414
ws6 = wpivot - (wphigh - wplow) * 1.618
ws7 = wpivot - (wphigh - wplow) * 2.000
//Mid level pivots
//PIVOT LEVEL CONDITIONS
closex = security(syminfo.tickerid, timeframe.period, close[1], gaps = barmerge.gaps_off, lookahead = barmerge.lookahead_on)
//WEEK LEVEL CONFIGURATION
// The notes are applicable to the other forumulas for the other time frames
// so I did not duplicate them further down
//Week Bull Rules
wcloseHigh10 = closex > wr6 and closex < wr7 //closex is above than wr6 and below wr7
wcloseHigh9 = closex > wr5 and closex < wr6 //closex is above than wr5 and below wr6
wcloseHigh8 = closex > wr4 and closex < wr5 //closex is above than wr4 and below wr5
wcloseHigh7 = closex > wr3 and closex < wr4 //closex is above than wr3 and below wr4
wcloseHigh6 = closex > wrc and closex < wr3 //closex is above than wrc and below wr3
wcloseHigh5 = closex > wr2 and closex < wrc //closex is above than wr2 and below wrc
wcloseHigh4 = closex > wrb and closex < wr2 //closex is above than wrb and below wr2
wcloseHigh3 = closex > wr1 and closex < wrb //closex is above than wr1 and below wrb
wcloseHigh2 = closex > wra and closex < wr1 //closex is above than wra and below wr1
wcloseHigh1 = closex > wpivot and closex < wra //closex is above than wpivot and below wra
//Week Bear Rules
wcloseLow1 = closex > wsa and closex < wpivot //closex is above than wsa and below wpivot
wcloseLow2 = closex > ws1 and closex < wsa //closex is above than ws1 and below wsa
wcloseLow3 = closex > wsb and closex < ws1 //closex is above than wsb and below ws1
wcloseLow4 = closex > ws2 and closex < wsb //closex is above than ws2 and below wsb
wcloseLow5 = closex > wsc and closex < ws2 //closex is above than wsc and below ws2
wcloseLow6 = closex > ws3 and closex < wsc //closex is above than ws3 and below wsc
wcloseLow7 = closex > ws4 and closex < ws3 //closex is above than ws4 and below ws3
wcloseLow8 = closex > ws5 and closex < ws4 //closex is above than ws5 and below ws4
wcloseLow9 = closex > ws6 and closex < ws5 //closex is above than ws6 and below ws5
wcloseLow10 = closex > ws7 and closex < ws6 //closex is above than ws7 and below ws6
//WEEK PRICE LEVELS//
//Week Resistance Price Levels
var float weekResistanceLevel = na
//output of resistance pivot level based on conditions above
weekResistanceLevel := wcloseHigh10 ? wr7 :
wcloseHigh9 ? wr6 :
wcloseHigh8 ? wr5 :
wcloseHigh7 ? wr4 :
wcloseHigh6 ? wr3 :
wcloseHigh5 ? wrc :
wcloseHigh4 ? wr2 :
wcloseHigh3 ? wrb :
wcloseHigh2 ? wr1 :
wcloseHigh1 ? wra :
wcloseLow1 ? wpivot :
wcloseLow2 ? wsa :
wcloseLow3 ? ws1 :
wcloseLow4 ? wsb :
wcloseLow5 ? ws2 :
wcloseLow6 ? wsc :
wcloseLow7 ? ws3 :
wcloseLow8 ? ws4 :
wcloseLow9 ? ws5 :
wcloseLow10 ? ws6 :
weekResistanceLevel
//Week Support Price Levels
var float weekSupportLevel = na
//output of support pivot level based on conditions above
weekSupportLevel := wcloseHigh10 ? wr6 :
wcloseHigh9 ? wr5 :
wcloseHigh8 ? wr4 :
wcloseHigh7 ? wr3 :
wcloseHigh6 ? wrc :
wcloseHigh5 ? wr2 :
wcloseHigh4 ? wrb :
wcloseHigh3 ? wr1 :
wcloseHigh2 ? wra :
wcloseHigh1 ? wpivot :
wcloseLow1 ? wsa :
wcloseLow2 ? ws1 :
wcloseLow3 ? wsb :
wcloseLow4 ? ws2 :
wcloseLow5 ? wsc :
wcloseLow6 ? ws3 :
wcloseLow7 ? ws4 :
wcloseLow8 ? ws5 :
wcloseLow9 ? ws6 :
wcloseLow10 ? ws7 :
weekSupportLevel
//WEEK LABEL PLOTS//
//Week Resistance Labels
var string weekResistanceLabel = na
//corresponding labels for pivot levels
weekResistanceLabel := wcloseHigh10 ? "WR7" :
wcloseHigh9 ? "WR6" :
wcloseHigh8 ? "WR5" :
wcloseHigh7 ? "WR4" :
wcloseHigh6 ? "WR3" :
wcloseHigh5 ? "WR-C" :
wcloseHigh4 ? "WR2" :
wcloseHigh3 ? "WR-B" :
wcloseHigh2 ? "WR1" :
wcloseHigh1 ? "WR-A" :
wcloseLow1 ? "WPi" :
wcloseLow2 ? "WS-A" :
wcloseLow3 ? "WS1" :
wcloseLow4 ? "WS-B" :
wcloseLow5 ? "WS2" :
wcloseLow6 ? "WS-C" :
wcloseLow7 ? "WS3" :
wcloseLow8 ? "WS4" :
wcloseLow9 ? "WS5" :
wcloseLow10 ? "WS6" :
weekResistanceLabel
//Week Support Labels
var string weekSupportLabel = na
weekSupportLabel := wcloseHigh10 ? "WR6" :
wcloseHigh9 ? "WR5" :
wcloseHigh8 ? "WR4" :
wcloseHigh7 ? "WR3" :
wcloseHigh6 ? "WR-C" :
wcloseHigh5 ? "WR2" :
wcloseHigh4 ? "WR-C" :
wcloseHigh3 ? "WR1" :
wcloseHigh2 ? "WR-A" :
wcloseHigh1 ? "WPi" :
wcloseLow1 ? "WS-A" :
wcloseLow2 ? "WS1" :
wcloseLow3 ? "WS-B" :
wcloseLow4 ? "WS2" :
wcloseLow5 ? "WS-C" :
wcloseLow6 ? "WS3" :
wcloseLow7 ? "WS4" :
wcloseLow8 ? "WS5" :
wcloseLow9 ? "WS6" :
wcloseLow10 ? "WS7" :
weekSupportLabel
//To remove the zero line level
//Week S/R Line & Label Plots
var line weekRLevel = na
var line weekSLevel = na
var label weekRLabel = na
var label weekSLabel = na
if Week_SR
weekRLevel := line.new(
x1 = bar_index[1],
y1 = weekResistanceLevel,
x2 = bar_index,
y2 = weekResistanceLevel,
extend = extend.both,
color = weekColor,
style = lineStyle,
width = 2)
line.delete(weekRLevel[1])
weekSLevel := line.new(
x1 = bar_index[1],
y1 = weekSupportLevel,
x2 = bar_index,
y2 = weekSupportLevel,
extend = extend.both,
color = weekColor,
style = lineStyle,
width = 2)
line.delete(weekSLevel[1])
weekRLabel := label.new(
x = start,
y = weekResistanceLevel,
text = weekResistanceLabel,
xloc = xloc.bar_time,
yloc = yloc.price,
style = label.style_none,
textcolor = color.white)
label.delete(weekRLabel[1])
weekSLabel := label.new(
x = start,
y = weekSupportLevel,
text = weekSupportLabel,
xloc = xloc.bar_time,
yloc = yloc.price,
style = label.style_none,
textcolor = color.white)
label.delete(weekSLabel[1])
//END OF WEEK CONFIGURATION//
//MONTH LEVEL CONFIGURATION
//Month Bull Rules
mcloseHigh1 = closex > mpivot and closex < mra
mcloseHigh2 = closex > mra and closex < mr1
mcloseHigh3 = closex > mr1 and closex < mrb
mcloseHigh4 = closex > mrb and closex < mr2
mcloseHigh5 = closex > mr2 and closex < mrc
mcloseHigh6 = closex > mrc and closex < mr3
mcloseHigh7 = closex > mr3 and closex < mr4
mcloseHigh8 = closex > mr4 and closex < mr5
mcloseHigh9 = closex > mr5 and closex < mr6
mcloseHigh10 = closex > mr6 and closex < mr7
//Month Bear Rules
mcloseLow1 = closex > msa and closex < mpivot
mcloseLow2 = closex > ms1 and closex < msa
mcloseLow3 = closex > msb and closex < ms1
mcloseLow4 = closex > ms2 and closex < msb
mcloseLow5 = closex > msc and closex < ms2
mcloseLow6 = closex > ms3 and closex < msc
mcloseLow7 = closex > ms4 and closex < ms3
mcloseLow8 = closex > ms5 and closex < ms4
mcloseLow9 = closex > ms6 and closex < ms5
mcloseLow10 = closex > ms7 and closex < ms6
//MONTH PRICE LEVELS//
//Month Resistance Price Levels
var float monthResistanceLevel = na
monthResistanceLevel := mcloseHigh10 ? mr7 :
mcloseHigh9 ? mr6 :
mcloseHigh8 ? mr5 :
mcloseHigh7 ? mr4 :
mcloseHigh6 ? mr3 :
mcloseHigh5 ? mrc :
mcloseHigh4 ? mr2 :
mcloseHigh3 ? mrb :
mcloseHigh2 ? mr1 :
mcloseHigh1 ? mra :
mcloseLow1 ? mpivot :
mcloseLow2 ? msa :
mcloseLow3 ? ms1 :
mcloseLow4 ? msb :
mcloseLow5 ? ms2 :
mcloseLow6 ? msc :
mcloseLow7 ? ms3 :
mcloseLow8 ? ms4 :
mcloseLow9 ? ms5 :
mcloseLow10 ? ms6 :
monthResistanceLevel
//Month Support Price Levels
var float monthSupportLevel = na
monthSupportLevel := mcloseHigh10 ? mr6 :
mcloseHigh9 ? mr5 :
mcloseHigh8 ? mr4 :
mcloseHigh7 ? mr3 :
mcloseHigh6 ? mrc :
mcloseHigh5 ? mr2 :
mcloseHigh4 ? mrb :
mcloseHigh3 ? mr1 :
mcloseHigh2 ? mra :
mcloseHigh1 ? mpivot :
mcloseLow1 ? msa :
mcloseLow2 ? ms1 :
mcloseLow3 ? msb :
mcloseLow4 ? ms2 :
mcloseLow5 ? msc :
mcloseLow6 ? ms3 :
mcloseLow7 ? ms4 :
mcloseLow8 ? ms5 :
mcloseLow9 ? ms6 :
mcloseLow10 ? ms7 :
monthSupportLevel
//MONTH LABEL PLOTS//
//Resistance Label Plots
var string monthResistanceLabel = na
//Bull Resistance Titles
monthResistanceLabel := mcloseHigh10 ? "MR7" :
mcloseHigh9 ? "MR6" :
mcloseHigh8 ? "MR5" :
mcloseHigh7 ? "MR4" :
mcloseHigh6 ? "MR3" :
mcloseHigh5 ? "MR-C" :
mcloseHigh4 ? "MR2" :
mcloseHigh3 ? "MR-B" :
mcloseHigh2 ? "MR1" :
mcloseHigh1 ? "MR-A" :
monthResistanceLabel
//Bear Resistance Titles
monthResistanceLabel := mcloseLow1 ? "MPi" :
mcloseLow2 ? "MS-A" :
mcloseLow3 ? "MS1" :
mcloseLow4 ? "MS-B" :
mcloseLow5 ? "MS2" :
mcloseLow6 ? "MS-C" :
mcloseLow7 ? "MS3" :
mcloseLow8 ? "MS4" :
mcloseLow9 ? "MS5" :
mcloseLow10 ? "MS6" :
monthResistanceLabel
//Support Label Plots
var string monthSupportLabel = na
//Bull Support Titles
monthSupportLabel := mcloseHigh10 ? "MR6" :
mcloseHigh9 ? "MR5" :
mcloseHigh8 ? "MR4" :
mcloseHigh7 ? "MR3" :
mcloseHigh6 ? "MR-C" :
mcloseHigh5 ? "MR2" :
mcloseHigh4 ? "MR-B" :
mcloseHigh3 ? "MR1" :
mcloseHigh2 ? "MR-A" :
mcloseHigh1 ? "MPib" :
monthSupportLabel
//Bear Support Titles
monthSupportLabel := mcloseLow1 ? "MS-A" :
mcloseLow2 ? "MS1" :
mcloseLow3 ? "MS-B" :
mcloseLow4 ? "MS2" :
mcloseLow5 ? "MS-C" :
mcloseLow6 ? "MS3" :
mcloseLow7 ? "MS4" :
mcloseLow8 ? "MS5" :
mcloseLow9 ? "MS6" :
mcloseLow10 ? "MS7" :
monthSupportLabel
//Month S/R Line & Label Plots
var line monthRLevel = na
var line monthSLevel = na
var label monthRLabel = na
var label monthSLabel = na
if Month_SR
monthRLevel := line.new(
x1 = bar_index[1],
y1 = monthResistanceLevel,
x2 = bar_index,
y2 = monthResistanceLevel,
extend = extend.both,
color = monthColor,
style = lineStyle,
width = 2)
line.delete(monthRLevel[1])
monthSLevel := line.new(
x1 = bar_index[1],
y1 = monthSupportLevel,
x2 = bar_index,
y2 = monthSupportLevel,
extend = extend.both,
color = monthColor,
style = lineStyle,
width = 2)
line.delete(monthSLevel[1])
monthRLabel := label.new(
x = start,
y = monthResistanceLevel,
text = monthResistanceLabel,
xloc = xloc.bar_time,
yloc = yloc.price,
style = label.style_none,
textcolor = color.white)
label.delete(monthRLabel[1])
monthSLabel := label.new(
x = start,
y = monthSupportLevel,
text = monthSupportLabel,
xloc = xloc.bar_time,
yloc = yloc.price,
style = label.style_none,
textcolor = color.white)
label.delete(monthSLabel[1])
//END OF MONTH CONFIGURATION//
//YEAR LEVEL CONFIGURATION//
//Year Bull Rules
ycloseHigh1 = closex > ypivot and closex < yra
ycloseHigh2 = closex > yra and closex < yr1
ycloseHigh3 = closex > yr1 and closex < yrb
ycloseHigh4 = closex > yrb and closex < yr2
ycloseHigh5 = closex > yr2 and closex < yrc
ycloseHigh6 = closex > yrc and closex < yr3
ycloseHigh7 = closex > yr3 and closex < yr4
ycloseHigh8 = closex > yr4 and closex < yr5
ycloseHigh9 = closex > yr5 and closex < yr6
ycloseHigh10 = closex > yr6 and closex < yr7
//Year Bear Rules
ycloseLow1 = closex > ysa and closex < ypivot
ycloseLow2 = closex > ys1 and closex < ysa
ycloseLow3 = closex > ysb and closex < ys1
ycloseLow4 = closex > ys2 and closex < ysb
ycloseLow5 = closex > ysc and closex < ys2
ycloseLow6 = closex > ys3 and closex < ysc
ycloseLow7 = closex > ys4 and closex < ys3
ycloseLow8 = closex > ys5 and closex < ys4
ycloseLow9 = closex > ys6 and closex < ys5
ycloseLow10 = closex > ys7 and closex < ys6
//YEAR PRICE LEVELS//
//Year Resistance Price Levels
var float yearResistanceLevel = na
yearResistanceLevel := ycloseHigh10 ? yr7 :
ycloseHigh9 ? yr6 :
ycloseHigh8 ? yr5 :
ycloseHigh7 ? yr4 :
ycloseHigh6 ? yr3 :
ycloseHigh5 ? yrc :
ycloseHigh4 ? yr2 :
ycloseHigh3 ? yrb :
ycloseHigh2 ? yr1 :
ycloseHigh1 ? yra :
ycloseLow1 ? ypivot :
ycloseLow2 ? ysa :
ycloseLow3 ? ys1 :
ycloseLow4 ? ysb :
ycloseLow5 ? ys2 :
ycloseLow6 ? ysc :
ycloseLow7 ? ys3 :
ycloseLow8 ? ys4 :
ycloseLow9 ? ys5 :
ycloseLow10 ? ys6 :
yearResistanceLevel
//Year Support Price Levels
var float yearSupportLevel = na
yearSupportLevel := ycloseHigh10 ? yr6 :
ycloseHigh9 ? yr5 :
ycloseHigh8 ? yr4 :
ycloseHigh7 ? yr3 :
ycloseHigh6 ? yrc :
ycloseHigh5 ? yr2 :
ycloseHigh4 ? yrb :
ycloseHigh3 ? yr1 :
ycloseHigh2 ? yra :
ycloseHigh1 ? ypivot :
ycloseLow1 ? ysa :
ycloseLow2 ? ys1 :
ycloseLow3 ? ysb :
ycloseLow4 ? ys2 :
ycloseLow5 ? ysc :
ycloseLow6 ? ys3 :
ycloseLow7 ? ys4 :
ycloseLow8 ? ys5 :
ycloseLow9 ? ys6 :
ycloseLow10 ? ys7 :
yearSupportLevel
//YEAR LABEL PLOTS//
//Year Resistance Labels
var string yearResistanceLabel = na
yearResistanceLabel := ycloseHigh10 ? "YWR7" :
ycloseHigh9 ? "YWR6" :
ycloseHigh8 ? "YWR5" :
ycloseHigh7 ? "YWR4" :
ycloseHigh6 ? "YWR3" :
ycloseHigh5 ? "YWR-C" :
ycloseHigh4 ? "YWR2" :
ycloseHigh3 ? "YWR-B" :
ycloseHigh2 ? "YWR1" :
ycloseHigh1 ? "YWR-A" :
ycloseLow1 ? "YWPi" :
ycloseLow2 ? "YWS-A" :
ycloseLow3 ? "YWS1" :
ycloseLow4 ? "YWS-B" :
ycloseLow5 ? "YWS2" :
ycloseLow6 ? "YWS-C" :
ycloseLow7 ? "YWS3" :
ycloseLow8 ? "YWS4" :
ycloseLow9 ? "YWS5" :
ycloseLow10 ? "YWS6" :
yearResistanceLabel
//Year Support Labels
var string yearSupportLabel = na
yearSupportLabel := ycloseHigh10 ? "YR6" :
ycloseHigh9 ? "YR5" :
ycloseHigh8 ? "YR4" :
ycloseHigh7 ? "YR3" :
ycloseHigh6 ? "YR-C" :
ycloseHigh5 ? "YR2" :
ycloseHigh4 ? "YR-B" :
ycloseHigh3 ? "YR1" :
ycloseHigh2 ? "YR-A" :
ycloseHigh1 ? "YPi" :
ycloseLow1 ? "YS-A" :
ycloseLow2 ? "YS1" :
ycloseLow3 ? "YS-B" :
ycloseLow4 ? "YS2" :
ycloseLow5 ? "YS-C" :
ycloseLow6 ? "YS3" :
ycloseLow7 ? "YS4" :
ycloseLow8 ? "YS5" :
ycloseLow9 ? "YS6" :
ycloseLow10 ? "YS7" :
yearSupportLabel
//Year S/R Line & Label Plots
var line yearRLevel = na
var line yearSLevel = na
var label yearRLabel = na
var label yearSLabel = na
if Year_SR
yearRLevel := line.new(
x1 = bar_index[1],
y1 = yearResistanceLevel,
x2 = bar_index,
y2 = yearResistanceLevel,
extend = extend.both,
color = yearColor,
style = lineStyle,
width = 2)
line.delete(yearRLevel[1])
yearSLevel := line.new(
x1 = bar_index[1],
y1 = yearSupportLevel,
x2 = bar_index,
y2 = yearSupportLevel,
extend = extend.both,
color = yearColor,
style = lineStyle,
width = 2)
line.delete(yearSLevel[1])
yearRLabel := label.new(
x = start,
y = yearResistanceLevel,
text = yearResistanceLabel,
xloc = xloc.bar_time,
yloc = yloc.price,
style = label.style_none,
textcolor = color.white)
label.delete(yearRLabel[1])
yearSLabel := label.new(
x = start,
y = yearSupportLevel,
text = yearSupportLabel,
xloc = xloc.bar_time,
style = label.style_none,
textcolor = color.white)
label.delete(yearSLabel[1])
//END OF SCRIPT
// Parameter
//************************************************** ************************************************** ********
indiSet = input(false, "âââââââââ MRC Parameter ââââââââ")
source = input(hlc3, title="Price Source", type=input.source)
type = input("SuperSmoother", title="Filter Type", options=["SuperSmoother", "Ehlers EMA", "Gaussian", "Butterworth", "BandStop", "SMA", "EMA", "RMA"])
length = input(5, title="Lookback Period",minval=1)
innermult = input(1.0, title="Inner Channel Size Multiplier", minval = 0.1)
outermult = input(2.415, title="Outer Channel Size Multiplier", minval = 0.1)
ChartSet = input(false, "âââââââââ Chart Setting ââââââââ")
drawchannel = input(false, title="Draw Channel")
displayzone = input(false, title="Draw Zone (With Channel)")
zonetransp = input(0, title="Zone Transparency", minval=0, maxval=100)
displayline = input(true, title="Display Line Extension")
MTFSet = input(false, "âââââââââ MTF Setting ââââââââ")
enable_mtf = input(false, title="Enable Multiple TimeFrame Analysis")
mtf_disp_typ= input("On Hover", title="MTF Display Type", options=["Always Display", "On Hover"])
mtf_typ = input("Auto", title="Multiple TimeFrame Type", options=["Auto", "Custom"])
mtf_lvl1 = input("D", title="Custom MTF Level 1", type=input.resolution)
mtf_lvl2 = input("W", title="Custom MTF Level 2", type=input.resolution)
//************************************************** ************************************************** ********
// Functions Start {
//************************************************** ************************************************** ********
var pi = 2 * asin(1)
var mult = pi * innermult
var mult2 = pi * outermult
var gradsize = 0.5
var gradtransp = zonetransp
//-----------------------
// Ehler SwissArmyKnife Function
//-----------------------
SAK_smoothing(_type, _src, _length) =>
c0 = 1.0
c1 = 0.0
b0 = 1.0
b1 = 0.0
b2 = 0.0
a1 = 0.0
a2 = 0.0
alpha = 0.0
beta = 0.0
gamma = 0.0
cycle = 2 * pi / _length
if _type == "Ehlers EMA"
alpha := (cos(cycle) + sin(cycle) - 1) / cos(cycle)
b0 := alpha
a1 := 1 - alpha
if _type == "Gaussian"
beta := 2.415 * (1 - cos(cycle))
alpha := -beta + sqrt((beta * beta) + (2 * beta))
c0 := alpha * alpha
a1 := 2 * (1 - alpha)
a2 := -(1 - alpha) * (1 - alpha)
if _type == "Butterworth"
beta := 2.415 * (1 - cos(cycle))
alpha := -beta + sqrt((beta * beta) + (2 * beta))
c0 := alpha * alpha / 4
b1 := 2
b2 := 1
a1 := 2 * (1 - alpha)
a2 := -(1 - alpha) * (1 - alpha)
if _type == "BandStop"
beta := cos(cycle)
gamma := 1 / cos(cycle*2*0.1) // delta default to 0.1. Acceptable delta -- 0.05<d<0.5
alpha := gamma - sqrt((gamma * gamma) - 1)
c0 := (1 + alpha) / 2
b1 := -2 * beta
b2 := 1
a1 := beta * (1 + alpha)
a2 := -alpha
if _type == "SMA"
c1 := 1 / _length
b0 := 1 / _length
a1 := 1
if _type == "EMA"
alpha := 2/(_length+1)
b0 := alpha
a1 := 1 - alpha
if _type == "RMA"
alpha := 1 / _length
b0 := alpha
a1 := 1 - alpha
_Input = _src
_Output = 0.0
_Output := (c0 * ((b0 * _Input) + (b1 * nz(_Input[1])) + (b2 * nz(_Input[2])))) + (a1 * nz(_Output[1])) + (a2 * nz(_Output[2])) - (c1 * nz(_Input[_length]))
//-----------------------
// SuperSmoother Function
//-----------------------
supersmoother(_src, _length) =>
s_a1 = exp(-sqrt(2) * pi / _length)
s_b1 = 2 * s_a1 * cos(sqrt(2) * pi / _length)
s_c3 = -pow(s_a1, 2)
s_c2 = s_b1
s_c1 = 1 - s_c2 - s_c3
ss = 0.0
ss := s_c1 * _src + s_c2 * nz(ss[1], _src[1]) + s_c3 * nz(ss[2], _src[2])
//-----------------------
// Auto TimeFrame Function
//-----------------------
// âââââ Converts current chart resolution into a float minutes value.
f_resInMinutes() =>
_resInMinutes = timeframe.multiplier * (
timeframe.isseconds ? 1. / 60 :
timeframe.isminutes ? 1. :
timeframe.isdaily ? 60. * 24 :
timeframe.isweekly ? 60. * 24 * 7 :
timeframe.ismonthly ? 60. * 24 * 30.4375 : na)
get_tf(_lvl)=>
y = f_resInMinutes()
z = timeframe.period
if(mtf_typ=="Auto")
if y < 1
z := _lvl == 1 ? "1" : _lvl == 2 ? "5" : z
else if y <= 3
z := _lvl == 1 ? "5" : _lvl == 2 ? "15" : z
else if y <= 10
z := _lvl == 1 ? "15" : _lvl == 2 ? "60" : z
else if y <= 30
z := _lvl == 1 ? "60" : _lvl == 2 ? "240" : z
else if y <= 120
z := _lvl == 1 ? "240" : _lvl == 2 ? "D" : z
else if y <= 240
z := _lvl == 1 ? "D" : _lvl == 2 ? "W" : z
else if y <= 1440
z := _lvl == 1 ? "W" : _lvl == 2 ? "M" : z
else if y <= 10080
z := _lvl == 1 ? "M" : z
else
z := z
else
z := _lvl == 1 ? mtf_lvl1 : _lvl == 2 ? mtf_lvl2 : z
z
//-----------------------
// Mean Reversion Channel Function
//-----------------------
get_mrc()=>
v_condition = 0
v_meanline = source
v_meanrange = supersmoother(tr, length)
//-- Get Line value
if(type == "SuperSmoother")
v_meanline := supersmoother(source, length)
if(type != "SuperSmoother")
v_meanline := SAK_smoothing(type, source, length)
v_upband1 = v_meanline+(v_meanrange*mult)
v_loband1 = v_meanline-(v_meanrange*mult)
v_upband2 = v_meanline+(v_meanrange*mult2)
v_loband2 = v_meanline-(v_meanrange*mult2)
//-- Check Condition
if(close > v_meanline)
v_upband2_1 = v_upband2 + (v_meanrange * gradsize * 4)
v_upband2_9 = v_upband2 + (v_meanrange * gradsize * -4)
if(high >= v_upband2_9 and high < v_upband2)
v_condition := 1
else if(high >= v_upband2 and high < v_upband2_1)
v_condition := 2
else if(high >= v_upband2_1)
v_condition := 3
else if(close <= v_meanline+v_meanrange)
v_condition := 4
else
v_condition := 5
if(close < v_meanline)
v_loband2_1 = v_loband2 - (v_meanrange * gradsize * 4)
v_loband2_9 = v_loband2 - (v_meanrange * gradsize * -4)
if(low <= v_loband2_9 and low > v_loband2)
v_condition := -1
else if(low <= v_loband2 and low > v_loband2_1)
v_condition := -2
else if(low <= v_loband2_1)
v_condition := -3
else if(close >= v_meanline+v_meanrange)
v_condition := -4
else
v_condition := -5
[v_meanline, v_meanrange, v_upband1, v_loband1, v_upband2, v_loband2, v_condition]
//-----------------------
// MTF Analysis
//-----------------------
get_stat(_cond) =>
ret = "Price at Mean Line\n"
if (_cond == 1)
ret := "Overbought (Weak)\n"
else if (_cond == 2)
ret := "Overbought\n"
else if (_cond == 3)
ret := "Overbought (Strong)\n"
else if (_cond == 4)
ret := "Price Near Mean\n"
else if (_cond == 5)
ret := "Price Above Mean\n"
else if (_cond == -1)
ret := "Oversold (Weak)\n"
else if (_cond == -2)
ret := "Oversold\n"
else if (_cond == -3)
ret := "Oversold (Strong)\n"
else if (_cond == -4)
ret := "Price Near Mean\n"
else if (_cond == -5)
ret := "Price Below Mean\n"
ret
//-----------------------
// Chart Drawing Function
//-----------------------
format_price(x) =>
y = tostring(x, "0.00000")
if(x>10)
y := tostring(x, "0.000")
if(x>1000)
y := tostring(x, "0.00")
y
f_PriceLine(_ref, linecol) =>
line.new(
x1 = bar_index, x2 = bar_index - 1,
y1 = _ref, y2 = _ref,
extend = extend.left,
color = linecol)
f_MTFLabel(_txt, _yloc) =>
label.new(
x = time + round(change(time)*20),
y = _yloc,
xloc = xloc.bar_time,
text = mtf_disp_typ == "Always Display" ? _txt : "Check MTF",
tooltip = mtf_disp_typ == "Always Display" ? "" : _txt,
color = color.black,
textcolor = color.white,
size = size.normal,
style = mtf_disp_typ == "On Hover" and displayline ? label.style_label_lower_left : label.style_label_left,
textalign = text.align_left)
//} Function End
//************************************************** ************************************************** ********
// Calculate Channel
//************************************************** ************************************************** ********
var tf_0 = timeframe.period
var tf_1 = get_tf(1)
var tf_2 = get_tf(2)
[meanline, meanrange, upband1, loband1, upband2, loband2, condition] = get_mrc()
[mtf1_meanline, mtf1_meanrange, mtf1_upband1, mtf1_loband1, mtf1_upband2, mtf1_loband2, mtf1_condition] = security(syminfo.tickerid, tf_1, get_mrc())
[mtf2_meanline, mtf2_meanrange, mtf2_upband1, mtf2_loband1, mtf2_upband2, mtf2_loband2, mtf2_condition] = security(syminfo.tickerid, tf_2, get_mrc())
//************************************************** ************************************************** ********
// Drawing Start {
//************************************************** ************************************************** ********
float p_meanline = drawchannel ? meanline : na
float p_upband1 = drawchannel ? upband1 : na
float p_loband1 = drawchannel ? loband1 : na
float p_upband2 = drawchannel ? upband2 : na
float p_loband2 = drawchannel ? loband2 : na
z = plot(p_meanline, color=#FFCD00, style=plot.style_line, title=" Mean", linewidth=2)
x1 = plot(p_upband1, color=color.green, style=plot.style_circles, title=" R1", linewidth=1, transp=50)
x2 = plot(p_loband1, color=color.green, style=plot.style_circles, title=" S1", linewidth=1, transp=50)
y1 = plot(p_upband2, color=color.red, style=plot.style_line, title=" R2", linewidth=1, transp=50)
y2 = plot(p_loband2, color=color.red, style=plot.style_line, title=" S2", linewidth=1, transp=50)
//-----------------------
// Draw zone
//-----------------------
//---
var color1 = #FF0000, var color2 = #FF4200, var color3 = #FF5D00, var color4 = #FF7400, var color5 = #FF9700, var color6 = #FFAE00, var color7 = #FFC500, var color8 = #FFCD00
//---
float upband2_1 = drawchannel and displayzone ? upband2 + (meanrange * gradsize * 4) : na, float loband2_1 = drawchannel and displayzone ? loband2 - (meanrange * gradsize * 4) : na
float upband2_2 = drawchannel and displayzone ? upband2 + (meanrange * gradsize * 3) : na, float loband2_2 = drawchannel and displayzone ? loband2 - (meanrange * gradsize * 3) : na
float upband2_3 = drawchannel and displayzone ? upband2 + (meanrange * gradsize * 2) : na, float loband2_3 = drawchannel and displayzone ? loband2 - (meanrange * gradsize * 2) : na
float upband2_4 = drawchannel and displayzone ? upband2 + (meanrange * gradsize * 1) : na, float loband2_4 = drawchannel and displayzone ? loband2 - (meanrange * gradsize * 1) : na
float upband2_5 = drawchannel and displayzone ? upband2 + (meanrange * gradsize * 0) : na, float loband2_5 = drawchannel and displayzone ? loband2 - (meanrange * gradsize * 0) : na
float upband2_6 = drawchannel and displayzone ? upband2 + (meanrange * gradsize * -1) : na, float loband2_6 = drawchannel and displayzone ? loband2 - (meanrange * gradsize * -1) : na
float upband2_7 = drawchannel and displayzone ? upband2 + (meanrange * gradsize * -2) : na, float loband2_7 = drawchannel and displayzone ? loband2 - (meanrange * gradsize * -2) : na
float upband2_8 = drawchannel and displayzone ? upband2 + (meanrange * gradsize * -3) : na, float loband2_8 = drawchannel and displayzone ? loband2 - (meanrange * gradsize * -3) : na
float upband2_9 = drawchannel and displayzone ? upband2 + (meanrange * gradsize * -4) : na, float loband2_9 = drawchannel and displayzone ? loband2 - (meanrange * gradsize * -4) : na
//-----------------------
// Plot Extension
//-----------------------
if(displayline and enable_mtf and mtf_disp_typ == "Always Display")
displayline := false
var line mean = na, line.delete(mean), mean := displayline ? f_PriceLine(meanline, #FFCD00) : na
var line res1 = na, line.delete(res1), res1 := displayline ? f_PriceLine(upband1, color.green) : na
var line sup1 = na, line.delete(sup1), sup1 := displayline ? f_PriceLine(loband1, color.green) : na
var line res2 = na, line.delete(res2), res2 := displayline ? f_PriceLine(upband2, color.red) : na
var line sup2 = na, line.delete(sup2), sup2 := displayline ? f_PriceLine(loband2, color.red) : na
//--------------
// Prep MTF Label
//--------------
var brl = "\n--------------------------------------"
dist_0 = "Distance from Mean: "+ tostring(((close-meanline)/close)*100, "#.##") + " %"
dist_1 = "Distance from Mean: "+ tostring(((close-mtf1_meanline)/close)*100, "#.##") + " %"
dist_2 = "Distance from Mean: "+ tostring(((close-mtf2_meanline)/close)*100, "#.##") + " %"
var title = "Mean Reversion Channel\nMultiple TimeFrame Analysis" + brl
tf0 =
"\n\nTimeframe: "+ tf_0 + " (Current)\n\nStatus: " + get_stat(condition) + dist_0 + brl
tf1 = not timeframe.ismonthly ?
"\n\nTimeframe: "+ tf_1 + "\n\nStatus: " + get_stat(mtf1_condition) + dist_1 + brl : ""
tf2 = not timeframe.isweekly and not timeframe.ismonthly ?
"\n\nTimeframe: "+ tf_2 + "\n\nStatus: " + get_stat(mtf2_condition) + dist_2 + brl : ""
mtf_lbl = title+tf0+tf1+tf2
var label label_mtf = na, label.delete(label_mtf), label_mtf := enable_mtf ? f_MTFLabel(mtf_lbl, meanline) : na
//} Drawing End
src = input(close)
len = input(5)
k = input(2.9652)
dispOR = input(false, title="Display outlier range")
dispBB = input(false, title="Use filtered SMA & MAD to create BB ?")
BBk = input(2.9652, title="BB mult")
median = percentile_nearest_rank(src,len,50)
MAD = percentile_nearest_rank(abs(src - median), len, 50)
up = median + MAD * k
dn = median - MAD * k
outlier = src >= up or src <= dn
sumsrc = 0.0
count = 0
for i = 0 to 5 * len
sumsrc := outlier[i] ? sumsrc : sumsrc + src[i]
count := outlier[i] ? count : count + 1
if count == len
break
meanx = sumsrc / count
plot(meanx, linewidth=2, color=color.white, title="?", transp=100)
input = input(close),robust = input(true)
//----
b=0.,sc=0.,a=0.
sc := robust ? abs(input - nz(b[1]))/(abs(input - nz(b[1])) + nz(a[1])) : 1
src11 = sc*input+(1-sc)*nz(b[1],input)
//----
n = cum(1)-1
a := cum(abs(src11 - nz(b[1],src11)))/n*(iff(robust,1,0)+sc)
b := src11 > nz(b[1],src11) + a ? src11 : src11 < nz(b[1],src11) - a ? src11 : nz(b[1],src11)
//----
plot(b,color=#E040FB ,linewidth=2,transp=0)
//@version=4
lb = input(50, title="Left Bars", minval=1)
rb = input(5, title="Right Bars", minval=1)
showpivot = input(true, title="Show Pivot Points")
chdashed = input(false, title="Show Old Line as Dashed")
ucolor = input(defval = color.black, title = "Uptrend line color")
dcolor = input(defval = color.black, title = "Downtrend line color")
mb = lb + rb + 1
float top = na
float bot = na
top := iff(not na(high[mb]), iff(highestbars(high, mb) == -rb, high[rb], na), na) // Pivot High
bot := iff(not na(low[mb]), iff(lowestbars(low, mb) == -rb, low[rb], na), na) // Pivot Low
plotshape(top and showpivot, text="PVS", style=shape.labeldown, color=color.yellow, textcolor=color.black, location=location.abovebar, offset = -rb)
plotshape(bot and showpivot, text="PVA", style=shape.labeldown, color=color.yellow, textcolor=color.black, location=location.belowbar, offset = -rb)
ltop = valuewhen(top, top, 1)
bst = 0
bst := top ? 1 : nz(bst[1]) + 1
float t_angle = 0.0
t_angle := t_angle[1]
if not na(ltop) and not na(top)
line tline = na
if ltop > top
tline := line.new(bar_index - bst[1] - rb, high[bst[1] + rb], bar_index - rb, high[rb], color = dcolor, extend = extend.right)
t_angle := (high[bst[1] + rb] - high[rb]) / bst[1]
if t_angle < t_angle[1] and t_angle[1] != 0
line.set_extend(tline[1], extend = extend.none)
if t_angle > t_angle[1] and t_angle[1] != 0
line.set_extend(tline, extend = extend.none)
if ltop <= top
t_angle := 0.0
if chdashed
line.set_style(tline[1], style = line.style_dashed)
lbot = valuewhen(bot, bot, 1)
bsb = 0
bsb := bot ? 1 : nz(bsb[1]) + 1
float b_angle = 0.0
b_angle := b_angle[1]
if not na(lbot) and not na(bot)
line bline = na
if lbot < bot
bline := line.new(bar_index - bsb[1] - rb, low[bsb[1] + rb], bar_index - rb, low[rb], color = ucolor, extend = extend.right)
b_angle := (low[bsb[1] + rb] - low[rb]) / bsb[1]
if b_angle > b_angle[1] and b_angle[1] != 0
line.set_extend(bline[1], extend = extend.none)
if b_angle < b_angle[1] and b_angle[1] != 0
line.set_extend(bline, extend = extend.none)
if lbot >= bot
b_angle := 0.0
if chdashed
line.set_style(bline[1], style = line.style_dashed)
// @version = 4
//////////////////////////////////////////////////////////////////////////////
// Inputs and global variable declarations
i_srcPrice = input ( close, "SMI Price Source", input.source )
i_SMI_len = input ( 4, "SMI Length", input.integer, minval = 1 )
i_smth1 = input ( 8, "Smooth Length 1", input.integer, minval = 1 )
i_smth2 = input ( 2, "Smooth Length 2", input.integer, minval = 1 )
i_sigLen = input ( 32, "Signal Length", input.integer, minval = 1 )
i_alrtInfo = input ( true, "Show Alert Levels Info", input.bool )
i_alrtHi = input ( 40, "Upper Alert Level", input.float, minval = -100, maxval = 100)
i_midLine = input ( 0, "Midline", input.integer, minval = -100, maxval = 100)
i_alrtLo = input ( -40, "Lower Alert Level", input.float, minval = -100, maxval = 100)
i_alrtLines = input ( false, "Show Alert Level Lines", input.bool )
i_infoBox = input ( true, "Show Info Box", input.bool )
i_decimalP = input ( 2, "Prices Decimal Places", input.integer, minval = 0, maxval = 10)
i_boxOffSet = input ( 5, "Info Box Offset", input.integer, minval = 1, maxval = 50)
ScaleHi = 100
ScaleLo = -100
var label Infobox = na
///////////////////////////////////////////////////////////////////////////////
// Declare Functions
f_truncdNum ( Val, DecPl ) =>
Fact = pow ( 10, DecPl )
int( Val * Fact) / Fact
// decimal truncation
a11(x) => 2 / (x + 1)
// exponentially weighted multiplier
f_reverse_SMI ( P, U, W, X, Y, Z ) =>
V = 0.5
H = highest(W)
L = lowest(W)
D = ema (( P - V * ( H + L )), X )[1]
E = ema ((( a11(X)* ( P - V * ( H + L )))+( D -D*a11(X))), Y )[1]
F = ema ( H - L , X )[1]
G = ema ((( a11(X)*( H -L ) + F*( 1 -a11(X)))), Y )[1]
J = 100 * (( a11(Y)* ( ( a11(X)* ( P - V * ( H + L ))) + ( D - D*a11(X)))) + ( E * ( 1 -a11(Y)) )) / ( V * (a11(Y)*((a11(X)*( H -L ) + F*( 1 -a11(X)))) + ( G*( 1 -a11(Y)))))[1]
K = ema ( ( 100 * (( a11(Y)* ( ( a11(X)* ( P - V * ( H + L ))) + ( D - D*a11(X)))) + ( E * ( 1 -a11(Y)) )) / ( V * (a11(Y)*((a11(X)*( H -L ) + F*( 1 -a11(X)))) + ( G*( 1 -a11(Y)))))), Z )[1]
rawReturn = ( V*U*(a11(Y)*a11(X)*H -a11(Y)*a11(X)*L -a11(Y)*F*a11(X) +a11(Y)*F -G*a11(Y) + G) + 100*(a11(Y)*a11(X)*V*H +a11(Y)*a11(X)*V*L -a11(Y)*D +a11(Y)*D*a11(X) +E*a11(Y) -E)) / ( 100*a11(Y)*a11(X))
return = rawReturn > 0 ? rawReturn : 0
// returns price where Stochastic Momentum Index is equal to input value "U"
// e.g. f_reverse_SMI ( close, 0, 13, 25, 2, 12 )
// would return the next closing price which would make SMI = 0
// the user can infer from this that.....
// closing above this price will cause the Stochastic Momentum Index to cross above the mid line
// and closing below it will cause the Stochastic Momentum Index to cross below the mid line
// This may also be used to give the SMI eq price (the price which would make the SMI equal to its prior value)
// this is done by inputing the prior value of the SMI (SMI[1]) as the "U" value
// e.g. f_reverse_SMI ( close, SMI[1], 13, 25, 2, 12 )
// The user can infer from this that.....
// closing above this price will cause the Stochastic Momentum Index to increase
// and closing below it will cause the Stochastic Momentum Index to decrease
// has a Return filter to replace any values below zero with zero
f_reverse_SMI_cross ( P, W, X, Y, Z ) =>
V = 0.5
H = highest(W)
L = lowest(W)
D = ema (( P - V * ( H + L )), X )[1]
E = ema (((a11(X)* ( P - V * ( H + L )))+( D -D*a11(X))), Y )[1]
F = ema ( H - L , X )[1]
G = ema (((a11(X)*( H -L ) + F*( 1 -a11(X)))), Y )[1]
J = 100 * (( a11(Y)* ( ( a11(X)* ( P - V * ( H + L ))) + ( D - D*a11(X)))) + ( E * ( 1 -a11(Y)) )) / ( V * (a11(Y)*((a11(X)*( H -L ) + F*( 1 -a11(X)))) + ( G*( 1 -a11(Y)))))[1]
K = ema ( ( 100 * (( a11(Y)* ( ( a11(X)* ( P - V * ( H + L ))) + ( D - D*a11(X)))) + ( E * ( 1 -a11(Y)) )) / ( V * (a11(Y)*((a11(X)*( H -L ) + F*( 1 -a11(X)))) + ( G*( 1 -a11(Y)))))), Z )[1]
rawReturn = ( a11(Y)*(100*( a11(Z)*(-a11(X)*V*H -a11(X)*V*L +D -D*a11(X) -a11(X) -E) +a11(X)*V*H +a11(X)*V*L -D +D*a11(X) +E) +V*K*(a11(X)*(-H*a11(Z) +H +L*a11(Z) -L +F*a11(Z) -F) -F*a11(Z) +F +G*a11(Z) -G)) +100*(a11(Z)*E-E) -V*K*G*a11(Z) +V*K*G)/(100*a11(Y)*a11(X)*(-a11(Z)+1))
return = rawReturn > 0 ? rawReturn : 0
// returns price where Stochastic Momentum Index is equal to the signal line
// the user can infer from this that.....
// closing above this price will cause the Stochastic Momentum Index to cross above the signal line
// and closing below it will cause the Stochastic Momentum Index to cross below the signal line
// has a Return filter to replace any values below zero with zero
f_delta ( P, X ) => X - P > 0
f_negVal ( X, D ) => X > 0 ? tostring ( f_truncdNum ( X, D )) : "İmkansız"
text_eq ( p, x, d ) => p > x ? "Boğa Devam (eq) : " + tostring(int(x*pow(10,d))/pow(10,d)) : "Ayı Devam (Eq) :" + tostring(int(x*pow(10,d))/pow(10,d))
f_crossText ( P, X, T, D ) => f_delta ( P, X ) ? "Yukarı Kesme " + T + " : " + f_negVal ( X, D ) + "\n" : "Aşağı Kesme " + T + " : " + f_negVal ( X, D ) + "\n"
//////////////////////////////////////////////////////////////////////////////
// Calculations
SMINumerator = ema ( ema ( i_srcPrice - 0.5 * ( highest (i_SMI_len) + lowest (i_SMI_len)), i_smth1 ), i_smth2 )
SMIDenominator = 0.5 * ema ( ema ( highest (i_SMI_len) - lowest (i_SMI_len), i_smth1 ), i_smth2 )
SMI = 100 * SMINumerator / SMIDenominator
SMI_eq = f_reverse_SMI ( i_srcPrice, SMI[1], i_SMI_len, i_smth1, i_smth2, i_sigLen )
alrtHilineCross = f_reverse_SMI ( i_srcPrice, i_alrtHi, i_SMI_len, i_smth1, i_smth2, i_sigLen )
zerolineCross = f_reverse_SMI ( i_srcPrice, 0, i_SMI_len, i_smth1, i_smth2, i_sigLen )
alrtLolineCross = f_reverse_SMI ( i_srcPrice, i_alrtLo, i_SMI_len, i_smth1, i_smth2, i_sigLen )
signalCross = f_reverse_SMI_cross ( i_srcPrice, i_SMI_len, i_smth1, i_smth2, i_sigLen )
///////////////////////////////////////////////////////////////////////////////
// Compute Info Label
labelXLoc = time_close + ( i_boxOffSet * ( time_close - time_close[1] ) )
crossSignalText = f_crossText ( i_srcPrice, signalCross, "Sinyal", i_decimalP )
SMIeq = text_eq ( i_srcPrice, SMI_eq, i_decimalP )
crossZeroText = f_crossText ( i_srcPrice, zerolineCross, "0 Noktası", i_decimalP )
crossAlrtHiText = f_crossText ( i_srcPrice, alrtHilineCross, "Tepe Alarm", i_decimalP )
crossAlrtLoText = f_crossText ( i_srcPrice, alrtLolineCross, "Dip Alarm", i_decimalP )
infoBoxText = i_alrtInfo ? "Yörük\n\n" + SMIeq + "\n\n" + crossAlrtHiText + "\n" + crossSignalText + "\n" + crossZeroText + "\n" + crossAlrtLoText : "Yörük\n\n" + SMIeq + "\n\n" + crossSignalText + "\n" + crossZeroText
///////////////////////////////////////////////////////////////////////////////
// InfoBox Plot
if i_infoBox
Infobox := label.new ( labelXLoc, close, infoBoxText, xloc.bar_time, yloc.price, #000000ff, label.style_label_left, color.yellow )
label.delete ( Infobox[1] )
///////////////////////////////////////////////////////////////////////////////
// SMI Plots & Fills
p_alrtHiPlot = plot ( i_alrtLines ? alrtHilineCross : na, "High", color.**ua, 1, plot.style_linebr, transp = 100 )
p_alrtLoPlot = plot ( i_alrtLines ? alrtLolineCross : na, "Low ", color.purple, 1, plot.style_linebr, transp = 100 )
p_SMI_eqPlot = plot ( SMI_eq, "Durum", SMI_eq < i_srcPrice ? color.green: color.red, 2, plot.style_linebr, transp = 100)
p_smiPlot = plot ( signalCross, "SinyalTakip", signalCross < i_srcPrice ? #0ebb23 : #FF0000, 2, plot.style_linebr, transp = 100)
p_MidLinePlot = plot ( zerolineCross, "O Noktası", color.white, 1, plot.style_linebr, transp = 100)
///////////////////////////////////////////////////////////////////////////////
// End


Yer İmleri