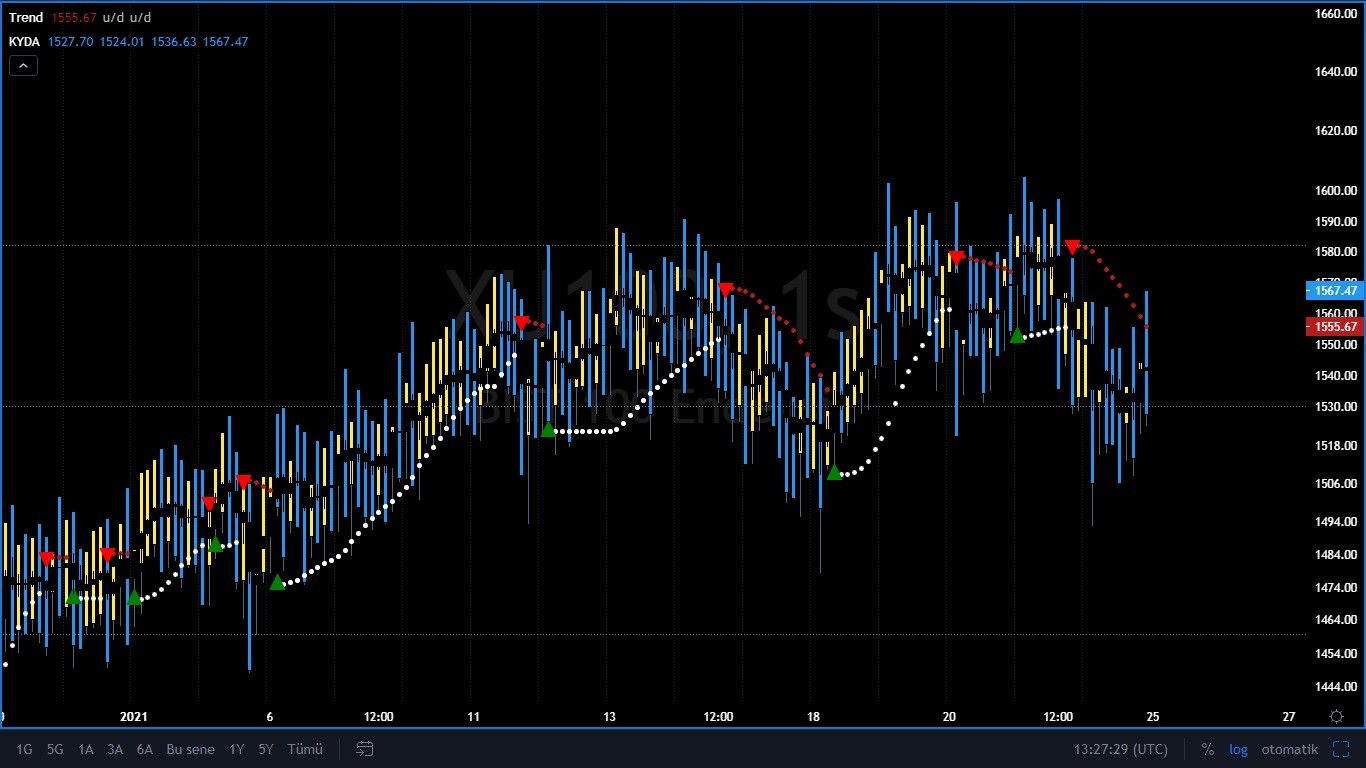
Special Days Image
Sayfa 26/272 İlkİlk ... 1624252627283676126 ... SonSon
Arama sonucu : 2172 madde; 201 - 208 arası.

Konu: Tradingview

  1. Kolay gelsin sayın yörük pine editöre eklediğimde

    line b = line.new(x1, y1, x2, y2, xloc.bar_index, extend.right, color.**ua, width=line_thick)

    44. satır: '*' karakterinde geçerli bir alternatif yok hatası veriyor.


    // This source code is subject to the terms of the Mozilla Public License 2.0 at https://mozilla.org/MPL/2.0/
    // © LucemAnb
    // User Version

    //@version=4
    study("Trend", "Yörük", overlay=true)


    source = input(close)
    length = input(100, minval=1)
    offset = input(0, minval=0)
    dev = input(2.0, "Deviation")
    smoothing = input(1, minval=1)
    mtf_val = input("", "Resolution", input.resolution)
    line_thick = input(4, "S&R Thickness", minval=1, maxval=4)
    signals = input("Recent", "Signals Display", options=["Recent", "All"])
    p = input("Lime", "Up Color", options=["Red", "Lime", "Orange", "Teal", "Yellow", "White", "Black"])
    q = input("Red", "Down Color", options=["Red", "Lime", "Orange", "Teal", "Yellow", "White", "Black"])
    goto = input(0, "End At Bar Index")

    cc(x) => x=="Red"?color.red:x=="Lime"?color.lime:x=="Orang e "?color.orange:x=="Teal"?
    color.teal:x=="Yellow"?color.yellow:x=="Black"?col or.black:color.white
    data(x) => sma(security(syminfo.tickerid, mtf_val!="" ? mtf_val : timeframe.period, x), smoothing)

    linreg = data(linreg(source, length, offset))
    linreg_p = data(linreg(source, length, offset+1))


    x = bar_index
    slope = linreg - linreg_p
    intercept = linreg - x*slope
    deviationSum = 0.0
    for i=0 to length-1
    deviationSum:= deviationSum + pow(source[i]-(slope*(x-i)+intercept), 2)
    deviation = sqrt(deviationSum/(length))
    x1 = x-length
    x2 = x
    y1 = slope*(x-length)+intercept
    y2 = linreg

    updating = goto <= 0 or x < goto

    if updating
    line b = line.new(x1, y1, x2, y2, xloc.bar_index, extend.right, color.**ua, width=line_thick)
    line.delete(b[1])
    line dp = line.new(x1, deviation*dev + y1, x2, deviation*dev + y2, xloc.bar_index, extend.right, cc(q), width=line_thick)
    line.delete(dp[1])
    line dm = line.new(x1, -deviation*dev + y1, x2, -deviation*dev + y2, xloc.bar_index, extend.right, cc(p), width=line_thick)
    line.delete(dm[1])

    dm_current = -deviation*dev + y2
    dp_current = deviation*dev + y2
    buy = crossunder(close, dm_current)
    sell = crossover(close, dp_current)
    alertcondition(buy, "Buy Lin Reg", "Crossing On the Lower Regression Channel")
    alertcondition(sell, "Sell Lin Reg", "Crossing On the Higher Regression Channel")

    plotshape(buy, "BUY", shape.labelup, location.belowbar, color.lime, text='BUY', textcolor=color.black, show_last=signals=="All"?99999999:length)
    plotshape(sell, "SELL", shape.labeldown, location.abovebar, color.red, text='SELL', textcolor=color.white, show_last=signals=="All"?99999999:length)

    plot(x, "Bar Index", color.**ua, line_thick, plot.style_cross, display=display.non

  2. sistem 4...

    görsel ve kodda oynama yapılmıştır....istediğiniz gibi değiştirebilirsiniz.....

    görüntüde fiyat hareketleri yani mumlar siyahla gizlenmiştir......

    trend ise en çok kullanılan ortalamar.....standart devinasyon ve bolinger banda...
    yavaşlatılmış sar eşlik etmekte..... ve sinyaller üretilmekte....

    trend scriptinin kodu ise;

    //@version=2
    study("Trend",overlay=true)
    activeSMA=input(true, title="activeSMA")

    plot(activeSMA?sma(close,10):na,color=black,linewi dth=1,transp=0,title="10")
    plot(activeSMA?sma(close,20):na,color=black,linewi dth=1,transp=0,title="20")
    plot(activeSMA?sma(close,50):na,color=blue,linewid th=1,transp=75,title="50")
    plot(activeSMA?sma(close,100):na,color=red,linewid th=1,transp=60,title="100")
    plot(activeSMA?sma(close,120):na,color=blue,linewi dth=1,transp=30,title="120")
    plot(activeSMA?sma(close,200):na,color=blue,linewi dth=2,transp=20,title="200")
    plot(activeSMA?sma(close,400):na,color=blue,linewi dth=2,transp=20,title="400")

    //@version=2

    activeBB=input(false, title="activeBB")
    source=input(close, title="BBSource")
    length=input(20, title="BBLength")
    mult=input(2.0, title="BBMultiply")

    dev=stdev(source,length)*mult

    base=sma(source,length)
    upper=base+dev
    lower=base-dev


    u=plot(activeBB?upper:na,color = red, title="Upper Band")
    plot(activeBB?base:na, color = black, title="Base Line")
    l=plot(activeBB?lower:na, color = green, title="Lower Nabd")
    fill(u,l, title="Bollinger Band")


    activeSAR=input(true, title="activePSAR")
    start = input(title="Start", type=float, step=0.0001, defval=0.02)
    increment = input(title="Increment", type=float, step=0.001, defval=0.02)
    maximum = input(title="Maximum", type=float, step=0.01, defval=0.2)
    width = input(title="Point Width", type=integer, minval=1, defval=2)
    highlightStartPoints = input(title="Highlight Start Points ?", defval=true)

    psar = sar(start, increment, maximum)
    dir = psar < close ? 1 : -1

    psarColor = psar < close ? #3388bb : #fdcc02
    plot(activeSAR?psar:na, title="ST", style=circles, linewidth=width, color=psarColor, transp=0)

    plotshape(dir == 1 and dir[1] == -1 and highlightStartPoints ? psar : na, title="Long Stop Start", location=location.absolute, style=shape.circle, size=size.small, color=green, transp=0)
    plotshape(dir == -1 and dir[1] == 1 and highlightStartPoints ? psar : na, title="Short Stop Start", location=location.absolute, style=shape.circle, size=size.small, color=red, transp=0)

    changeCond = dir != dir[1]
    alertcondition(changeCond, title="Alert on Parabolic SAR Direction Change", message="Parabolic SAR has changed direction!")

    // len=input(defval=20,minval=1)
    // p=close
    // sma=sma(p,len)
    // avg=atr(len)
    // fibratio1=input(defval=1.618,title="Fibonacci Ratio 1")
    // fibratio2=input(defval=2.618,title="Fibonacci Ratio 2")
    // fibratio3=input(defval=4.236,title="Fibonacci Ratio 3")
    // r1=avg*fibratio1
    // r2=avg*fibratio2
    // r3=avg*fibratio3
    // top3=sma+r3
    // top2=sma+r2
    // top1=sma+r1
    // bott1=sma-r1
    // bott2=sma-r2
    // bott3=sma-r3

    // t3=plot(top3,transp=0,title="Upper 3",color=teal)
    // t2=plot(top2,transp=20,title="Upper 2",color=teal)
    // t1=plot(top1,transp=40,title="Upper 1",color=teal)
    // b1=plot(bott1,transp=40,title="Lower 1",color=teal)
    // b2=plot(bott2,transp=20,title="Lower 2",color=teal)
    // b3=plot(bott3,transp=0,title="Lower 3",color=teal)
    // fill(t3,b3,color=navy,transp=85)


    kyda ise sadece ohlc değerlerini alan ve bunları indikaör gibi kullanıp...
    yine bulunduğu aynı bara olası.....ohlc değerleri hesaplatıyor....
    yani bulunan barda gerçekleşen değer ile olası ohlc değerleri aynı anda oluşuyor...

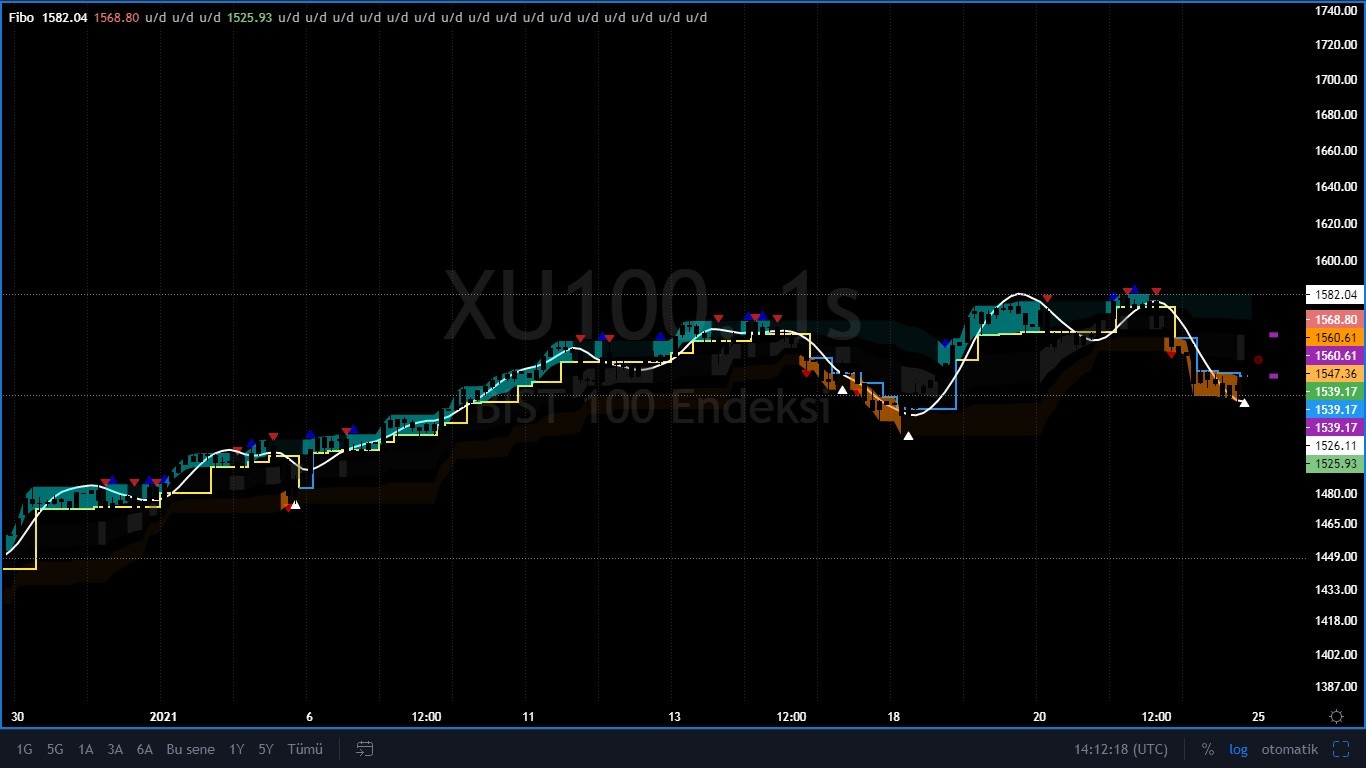
    kyda script kodu ise;

    //@version=4
    study("KYDA" , overlay = true)

    src = close

    o = open
    h = high
    l = low
    c = close

    _indicator1 = ((o - o[1] ) / (o[1]))
    _indicator2 = ((h - h[1] ) / (h[1]))
    _indicator3 = ((l - l[1] ) / (l[1]))
    _indicator4 = ((c - c[1] ) / (c[1]))
    _indicator5 = (src - src[1]) / src[1]

    // Inputs on Tangent Function :

    tangentdiff(_src) => nz((_src - _src[1]) / _src[1] )


    // Deep Learning Activation Function (Tanh) :

    ActivationFunctionTanh(v) => (1 - exp(-2 * v))/( 1 + exp(-2 * v))


    // DEEP LEARNING

    // INPUTS :

    input_1 = (_indicator1)
    input_2 = (_indicator2)
    input_3 = (_indicator3)
    input_4 = (_indicator4)


    // LAYERS :

    // Input Layers

    n_0 = ActivationFunctionTanh(input_1 + 0)
    n_1 = ActivationFunctionTanh(input_2 + 0)
    n_2 = ActivationFunctionTanh(input_3 + 0)
    n_3 = ActivationFunctionTanh(input_4 + 0)


    //


    fun_open() =>

    float _output = na

    n_4 = ActivationFunctionTanh(0.030535 * n_0 + 5.113012 * n_1 + -26.085717 * n_2 + -5.320280 * n_3 + 7.354752 )

    n_5 = ActivationFunctionTanh(4.167948 * n_0 + 7.225875 * n_1 + -0.871215 * n_2 + -8.894535 * n_3 + -7.064751 )

    n_6 = ActivationFunctionTanh(-0.806293 * n_0 + -0.304470 * n_1 + -3.909741 * n_2 + -5.009985 * n_3 + 5.127558 )

    n_7 = ActivationFunctionTanh(-29.736063 * n_0 + 28.668433 * n_1 + 0.138417 * n_2 + -57.588543 * n_3 + 2.824914 )

    n_8 = ActivationFunctionTanh(-0.429393 * n_0 + 0.482744 * n_1 + -0.789797 * n_2 + -2.987460 * n_3 + -4.310747 )

    n_9 = ActivationFunctionTanh(1.758357 * n_0 + -0.618090 * n_1 + 2.449362 * n_2 + -1.583126 * n_3 + 1.165846 )

    _output := ActivationFunctionTanh(-0.653030 * n_4 + -4.646999 * n_5 + -1.678999 * n_6 + -17.077652 * n_7 + 0.875426 * n_8 + -6.672465 * n_9 + 6.940722)


    fun_high() =>

    float _output = na

    n_4 = ActivationFunctionTanh(10.186543 * n_0 + -30.964897 * n_1 + 21.672385 * n_2 + -40.895894 * n_3 + 7.957443 )

    n_5 = ActivationFunctionTanh(-15.252332 * n_0 + 14.845403 * n_1 + 10.621491 * n_2 + -23.817824 * n_3 + 2.947530 )

    n_6 = ActivationFunctionTanh(-15.179010 * n_0 + -30.011878 * n_1 + 35.650459 * n_2 + -61.480486 * n_3 + 3.898503 )

    n_7 = ActivationFunctionTanh(35.656454 * n_0 + -11.134354 * n_1 + -28.071578 * n_2 + 2.923959 * n_3 + -1.805703 )

    n_8 = ActivationFunctionTanh(3.462374 * n_0 + -13.644019 * n_1 + -30.226394 * n_2 + -1.083953 * n_3 + 23.032872 )

    n_9 = ActivationFunctionTanh(-47.265829 * n_0 + 19.021801 * n_1 + 10.565216 * n_2 + -27.520789 * n_3 + 6.947500 )

    _output := ActivationFunctionTanh(-0.696537 * n_4 + -1.349433 * n_5 + 27.262956 * n_6 + -1.042353 * n_7 + -0.540196 * n_8 + -10.735585 * n_9 + 1.303216)


    fun_low() =>

    float _output = na

    n_4 = ActivationFunctionTanh(4.363108 * n_0 + -18.301472 * n_1 + -15.376884 * n_2 + 21.208559 * n_3 + -0.458119 )

    n_5 = ActivationFunctionTanh(-2.651826 * n_0 + 5.205410 * n_1 + -5.920993 * n_2 + -4.847458 * n_3 + 8.315580 )

    n_6 = ActivationFunctionTanh(13.885322 * n_0 + -5.517922 * n_1 + -15.241118 * n_2 + -8.673229 * n_3 + -4.954015 )

    n_7 = ActivationFunctionTanh(10.490466 * n_0 + -25.201536 * n_1 + 10.262121 * n_2 + -1.116144 * n_3 + -5.254103 )

    n_8 = ActivationFunctionTanh(-14.687736 * n_0 + 9.030202 * n_1 + -17.332462 * n_2 + 8.068070 * n_3 + 0.755134 )

    n_9 = ActivationFunctionTanh( 0.895168 * n_0 + -1.737740 * n_1 + 4.899143 * n_2 + -7.718495 * n_3 + 5.493688 )

    _output := ActivationFunctionTanh(4.132907 * n_4 + -17.501595 * n_5 + 4.617443 * n_6 + -28.476857 * n_7 + -5.888234 * n_8 + -24.434500 * n_9 + 41.318760)


    fun_close() =>

    float _output = na

    n_4 = ActivationFunctionTanh(22.427157 * n_0 + -26.691701 * n_1 + 4.937141 * n_2 + 9.034960 * n_3 + -10.692978 )

    n_5 = ActivationFunctionTanh(-38.288087 * n_0 + 10.050028 * n_1 + -44.706345 * n_2 + -17.816354 * n_3 + 30.566226 )

    n_6 = ActivationFunctionTanh(-33.995444 * n_0 + 14.501766 * n_1 + -43.286508 * n_2 + -13.387415 * n_3 + 24.708075 )

    n_7 = ActivationFunctionTanh(-14.392948 * n_0 + 28.483095 * n_1 + -22.979338 * n_2 + -7.658263 * n_3 + -5.650564 )

    n_8 = ActivationFunctionTanh(28.837901 * n_0 + -26.354494 * n_1 + 0.520683 * n_2 + 25.004913 * n_3 + -17.883236 )

    n_9 = ActivationFunctionTanh(-4.811354 * n_0 + -4.036420 * n_1 + -8.332775 * n_2 + -1.157164 * n_3 + 0.466793 )

    _output := ActivationFunctionTanh(-22.053311 * n_4 + 3.652552 * n_5 + -4.390465 * n_6 + 2.103060 * n_7 + 20.027285 * n_8 + 11.510129 * n_9 + -0.415015)


    // Current Open Values

    _chg_open = tangentdiff(o) * 100

    _seed_open = (fun_open() - _chg_open) / 100

    f_open = o * (1 - _seed_open)

    // Current High Values

    _chg_high = tangentdiff(h) * 100

    _seed_high = (fun_high() - _chg_high) / 100

    f_high = h * (1 - _seed_high)

    // Current Low Values

    _chg_low = tangentdiff(l) * 100

    _seed_low = (fun_low() - _chg_low) / 100

    f_low = l * (1 - _seed_low)

    // Current Close Values

    _chg_c = tangentdiff(c) * 100

    _seed_c = (fun_close() - _chg_c) / 100

    f_close= c * (1 - _seed_c)


    plotcandle(f_close,f_high,f_low,f_open,color=f_clo se>f_close[1]?color.teal:color.maroon,wickcolor=#5d606b )
    Son düzenleme : @yörük@; 24-01-2021 saat: 17:09.
    Teknik olarak; yarına gebe olan bugünü yaşamalı ki, yarın, yaşanmış olsun.

  3. sistemlerin back testini yapabildiniz mi sayın yörük.!!

  4. sistem 5....


    fibo....donkan kanalları, atr kullanılıyor.... amaç sonraki barın olasılığını ve trendin yönünü hesaplatmak....

    sonda oluşan iki kalın çizgi kanal aralığı....
    önündeki oluşan yuvarlak rengine göre trendin gücünü ve yönünü.....
    oluşan artı işareti ise hedefi belirtiyor......

    görseli ve kodu istediğiniz kadar değiştirebilirsiniz....

    script kodu ise;


    //@version=3
    study("Donchian Fibonacci Zones with Trading Features", shorttitle="Fibo", overlay=true)
    //INPUTS
    per=input(20, type=integer, minval=15, maxval=60)
    preunit=input('atr', title="prediction in atr or percent", options=['atr', 'percent'])
    preamount=input(1, title="added amount of prediction", type=float, minval=0, maxval=6)

    //CHANNEL
    hb= highest(high,per) //High Border
    lb = lowest(low,per) //Low Border
    dist = hb-lb //range of the channel
    med = (hb+lb)/2 //median of the channel

    hf = hb-dist*0.236 //Highest Fib
    chf = hb-dist*0.382 //Center High Fib
    clf = hb-dist*0.618 //Center Low Fib
    lf = hb-dist*0.764 //Lowest Fib

    //PULL BACK LEVELS
    //initialise mutatables
    leh=hb
    lel=lb
    hbtrue=true

    evpup = high>hb[1] //push up event
    evhbstart = hb[3]==hb[2] and hb[2]==hb[1] and evpup //horizontal then up, part of evhb calculation
    evpdown = low<lb[1] //push down event
    evlbstart = lb[3]==lb[2] and lb[2]==lb[1] and evpdown //horizontal then down, part of evlb calculation

    //two levels will be merged in the plot
    evhb = evhbstart or high[1] == hb //event with high border
    leh := evhb? hf :leh[1] //level high mutatable set to highest fib on event or kept on value
    evlb = evlbstart or low[1] == lb //event with low border
    lel := evlb? lf :lel[1] //level low mutatable set to lowest fib on event or kept on value
    hbtrue := evhb?true :evlb?false :hbtrue[1] //last event mutatable

    //ENTRY MARKERS
    tol=atr(per)*0.2 //tolerance for placing triangles and prediction candles at borders
    //initialise mutatables
    hftrue = true
    lftrue = true
    cftrue = true
    evupin = crossover(close, hf) //market enters up trend
    evupout = crossunder(close, hf) //market leaves up trend
    hftrue := evupin? true :evupout? false :hftrue[1] //mutatable true if in up trend
    evdownin = crossunder(close, lf) //market enters down trend
    evdownout = crossover(close, lf) //market leaves down trend
    lftrue := evdownin? true :evdownout? false :lftrue[1] //mutatable true if in down trend
    cftrue := not hftrue and not lftrue? true : false //mutatable true if instrument is ranging

    //IDENTIFY LAST BAR
    last= barstate.islast
    last:= barstate.isrealtime and isintraday? not barstate.isconfirmed :barstate.islast
    //barstate.islast works also when all bars are confirmed and are history. However in real time and intradaycharts bars never lose this state.
    //In that situation 'not barstate.isconfirmed' (like not ishistory) is the better alternative. if you use intraday charts after closing time of
    //the markets "barstate.isrealtime and isintraday" will be false and the script will use barstate.islast.

    //SITUATION
    hbdtrue = last and hftrue //up trend
    lbdtrue = last and lftrue //down trend
    chfdtrue = last and cftrue and hbtrue //high ranging
    clfdtrue = last and cftrue and not hbtrue //low ranging

    //expected levels
    schigh = hb
    schigh := hbdtrue? hb :lbdtrue? lf :chfdtrue? hf :clfdtrue? chf :na //situation candle high
    sclow = lb
    sclow := hbdtrue? hf :lbdtrue? lb :chfdtrue? clf :clfdtrue? lf :na //situation candle low

    //prediction levels
    pred= preunit=='atr'? preamount*atr(per) reunit=='percent'? preamount*close/100 :0
    prcahigh = med
    prcahigh := hbdtrue and (evpup or evpup[1])? hb+pred :na //prediction level higher than high border
    prcalow = med
    prcalow := lbdtrue and (evpdown or evpdown[1])? lb-pred :na //prediction level lower than low border

    //HULL MOVING AVERAGE
    hma = wma((2 * wma(close, per / 2)) - wma(close, per), round(sqrt(per)))


    //PLOTTINGS
    //plot channel and fibzones
    phb=plot(hbdtrue? na :hb, title="high border", color=black)
    phf = plot(hbdtrue or chfdtrue? na :hf, title="highest fib", color=gray, transp=80)
    pchf = plot(last? na :chf, title="centhi fib", color=gray, transp=80)
    pclf = plot(last? na :clf, title="centlo fib", color=gray, transp=80)
    plf = plot(lbdtrue or clfdtrue? na :lf, title= "lowest fib", color= gray, transp= 80)
    plb = plot(lbdtrue? na :lb, title="low border", color=black)

    fill(phb,phf, color= hftrue? #00FFFF70 :#00FFFF10, title="up trend zone") //up trend zone, blue or transparant blue
    fill(pchf,pclf, color= cftrue?#40404060 :#40404010, title="ranging zone") // ranging zone, dark gray or light gray
    fill(plf,plb, color= lftrue? #FF800099 :#FF800010, title="down trend zone") //down trend zone, orange or transparant orange

    //plot pull back levels
    plot(last? na :hbtrue?leh:lel, title="Swing", color= hbtrue?#0000ff99:#ff000099, linewidth=2, style=line) //levels blue purple

    //plot entry markers
    plotshape(evupin?hb+tol :na, style=shape.triangleup, location=location.absolute, color=blue, size=size.tiny)
    plotshape(evupout?hb+tol :na, style=shape.xcross, location=location.absolute, color=gray, size=size.tiny)
    plotshape(evdownin?lb-tol :na, style=shape.triangledown, location=location.absolute, color=red, size=size.tiny)
    plotshape(evdownout?lb-tol :na, style=shape.xcross, location=location.absolute, color=gray, size=size.tiny)

    //plot future circle markers
    plotshape(hbdtrue?hb:na, style=shape.circle, location=location.absolute, color=blue, offset=1, size=size.tiny)
    plotshape(lbdtrue?lb:na, style=shape.circle, location=location.absolute, color=red, offset=1, size=size.tiny)
    plotshape(chfdtrue?chf:na, style=shape.circle, location=location.absolute, color=green, offset=1, size=size.tiny)
    plotshape(clfdtrue?clf:na, style=shape.circle, location=location.absolute, color=maroon, offset=1, size=size.tiny)

    //plot expected range levels
    plot(schigh, linewidth = 5, title=" expect", color=teal, offset=3)
    plot(sclow, linewidth = 5, title=" expect", color=teal, offset=3)

    //plot prediction levels
    plot(last and (evpup or evpup[1]) and preamount>0?prcahigh :na, style=cross, title=" predict", linewidth = 5, color = blue, offset=3)
    plot(last and (evpdown or evpdown[1]) and preamount>0?prcalow :na, style=cross, title=" predict", linewidth = 5, color = red, offset=3)

    //plot predictionmarkers
    plotshape(hbdtrue and (evpup or evpup[1])? hb+tol :na, style=shape.diamond, location=location.absolute, color=blue, size=size.tiny, offset=3)
    plotshape(lbdtrue and (evpdown or evpdown[1])? lb-tol :na, style=shape.diamond, location=location.absolute, color=red, size=size.tiny, offset=3)

    //plot Hull moving average
    plot(last? na :hma, title="Hull ma", linewidth=1, color=navy)
    Teknik olarak; yarına gebe olan bugünü yaşamalı ki, yarın, yaşanmış olsun.

  5. velhasıl... tekniğin sonu yok....altın formül yok..... amerikayı yeniden keşfetmeye gerek yok.....

    sıfırdan kod yazmaya gerek yok.... açık kaynak kodların espirisi.....

    üzerlerinde oynama yapılabilmesidir....... yazan kişi örneğin atryi 20 hesaplatmıştır.....
    ama siz periyodu düşük kullanacağınız için hızlandırmak isterseniz değeri 10a çevirirsiniz....

    psarı bilinen değeri ile kullanılmıştır ama siz düşük periyotta onu stop olarak kullanmak isteyince 0.001 gibi yavaşlatırsınız....


    sürekli deneyimlemeler sonucu....birinde karar kılabiliriz....

    tek ekrana indikatörleri ekler....görselleri sadeleştirebiliriz....

    ekranı dörde böler....farklı sistemler kurarak...birbirlerinin teyitlerine bakabiliriz....


    Hülasa, nasibimizi.... temel teknikle ararız...... nasib olanı ya kazanırız ya da kaybederiz.....

    ama temel-teknik kullanmaya çalıştığımız için.....yalnızca kendimizi suçlar.....kendimizi geliştirmeye çalışırız....

    bence insan başkasını suçladığı sürece kendini geliştirmeye kapamış olur.....


    burda yazılanların amacı.....
    tekniğe ilgi çekmek.....tekniksiz kalmamak adınadır.....
    Teknik olarak; yarına gebe olan bugünü yaşamalı ki, yarın, yaşanmış olsun.

  6. son olarak uzun süredir.....kullandığım basit sistemim ise....

    üç psardan oluşmaktadır......psarların uzunluğu 100, sapması 1.9 dur.....

    sadece psarların hesaplama değerlerinde oynama yaparak.....kısa-orta-uzun vade gibi periyotlarada kullanılmıştır...
    mtf anlamında değildir......

    psaradı başlangıç artım maksimum
    kısa vade için 0 0.1 0.2
    orta vade için 0 0.01 0.2
    uzun vade için 0 0.001 0.2

    selamlar...........nasibleriniz bol olması dileğiyle................tekniğe inanmayın.........tekniksiz kalmayın........
    Teknik olarak; yarına gebe olan bugünü yaşamalı ki, yarın, yaşanmış olsun.

  7.  Alıntı Originally Posted by mirror Yazıyı Oku
    Kolay gelsin sayın yörük pine editöre eklediğimde

    line b = line.new(x1, y1, x2, y2, xloc.bar_index, extend.right, color.**ua, width=line_thick)

    44. satır: '*' karakterinde geçerli bir alternatif yok hatası veriyor.


    // This source code is subject to the terms of the Mozilla Public License 2.0 at https://mozilla.org/MPL/2.0/
    // © LucemAnb
    // User Version

    //@version=4
    study("Trend", "Yörük", overlay=true)


    source = input(close)
    length = input(100, minval=1)
    offset = input(0, minval=0)
    dev = input(2.0, "Deviation")
    smoothing = input(1, minval=1)
    mtf_val = input("", "Resolution", input.resolution)
    line_thick = input(4, "S&R Thickness", minval=1, maxval=4)
    signals = input("Recent", "Signals Display", options=["Recent", "All"])
    p = input("Lime", "Up Color", options=["Red", "Lime", "Orange", "Teal", "Yellow", "White", "Black"])
    q = input("Red", "Down Color", options=["Red", "Lime", "Orange", "Teal", "Yellow", "White", "Black"])
    goto = input(0, "End At Bar Index")

    cc(x) => x=="Red"?color.red:x=="Lime"?color.lime:x=="Orang e "?color.orange:x=="Teal"?
    color.teal:x=="Yellow"?color.yellow:x=="Black"?col or.black:color.white
    data(x) => sma(security(syminfo.tickerid, mtf_val!="" ? mtf_val : timeframe.period, x), smoothing)

    linreg = data(linreg(source, length, offset))
    linreg_p = data(linreg(source, length, offset+1))


    x = bar_index
    slope = linreg - linreg_p
    intercept = linreg - x*slope
    deviationSum = 0.0
    for i=0 to length-1
    deviationSum:= deviationSum + pow(source[i]-(slope*(x-i)+intercept), 2)
    deviation = sqrt(deviationSum/(length))
    x1 = x-length
    x2 = x
    y1 = slope*(x-length)+intercept
    y2 = linreg

    updating = goto <= 0 or x < goto

    if updating
    line b = line.new(x1, y1, x2, y2, xloc.bar_index, extend.right, color.**ua, width=line_thick)
    line.delete(b[1])
    line dp = line.new(x1, deviation*dev + y1, x2, deviation*dev + y2, xloc.bar_index, extend.right, cc(q), width=line_thick)
    line.delete(dp[1])
    line dm = line.new(x1, -deviation*dev + y1, x2, -deviation*dev + y2, xloc.bar_index, extend.right, cc(p), width=line_thick)
    line.delete(dm[1])

    dm_current = -deviation*dev + y2
    dp_current = deviation*dev + y2
    buy = crossunder(close, dm_current)
    sell = crossover(close, dp_current)
    alertcondition(buy, "Buy Lin Reg", "Crossing On the Lower Regression Channel")
    alertcondition(sell, "Sell Lin Reg", "Crossing On the Higher Regression Channel")

    plotshape(buy, "BUY", shape.labelup, location.belowbar, color.lime, text='BUY', textcolor=color.black, show_last=signals=="All"?99999999:length)
    plotshape(sell, "SELL", shape.labeldown, location.abovebar, color.red, text='SELL', textcolor=color.white, show_last=signals=="All"?99999999:length)

    plot(x, "Bar Index", color.**ua, line_thick, plot.style_cross, display=display.non


    Elinize, emeğinize sağlık sayın @yörük@.


    Yukarıdaki arkadaşa cevap verirken size de hatırlatmış olayım.
    Daha önce tecrübe ettiğim için biliyorum:

    Bir renk olan,
    Kod:
    "fuchsia"
    forum yazılımı tarafından "küfür" olarak algılandığından ** ile manipüle ediliyor.

    Değerli kod paylaşımlarınızı gönderirken "gelişmiş özellikler" i tıklayarak,
    #' i seçerek kod parantezi arasına yazarsanız hayat okuyucularınız için de daha kolay olur.

    Sağlık, mutluluk, başarı dileklerimle.
    https://www.kisavade.com/
    Al,sat,tut,yakala,sık,bırak vb. tavsiye için aracı kurumunuzla görüşün.

  8. teşekkürler.. obblomovv...
    selamlar...
    Teknik olarak; yarına gebe olan bugünü yaşamalı ki, yarın, yaşanmış olsun.

Sayfa 26/272 İlkİlk ... 1624252627283676126 ... SonSon

Yer İmleri

Yer İmleri

Gönderi Kuralları

  • Yeni konu açamazsınız
  • Konulara cevap yazamazsınız
  • Yazılara ek gönderemezsiniz
  • Yazılarınızı değiştiremezsiniz
  •