PHP Code:
//@version=5
indicator("Triple Sar", overlay = true)
//Avarage SAR
psar(start1, inc1, maximum1) =>
out1 = float(na)
isUpTrend1 = bool(na)
maxMin1 = float(na)
acc1 = float(na)
prev1 = float(na)
if bar_index >= 1
prev1 := out1[1]
if bar_index == 1
if close > close[1]
isUpTrend1 := true
maxMin1 := math.max(high, high[1])
prev1 := math.min(low, low[1])
prev1
else
isUpTrend1 := false
maxMin1 := math.min(low, low[1])
prev1 := math.max(high, high[1])
prev1
acc1 := start1
acc1
else
isUpTrend1 := isUpTrend1[1]
acc1 := acc1[1]
maxMin1 := maxMin1[1]
maxMin1
if isUpTrend1
if high > maxMin1
maxMin1 := high
acc1 := math.min(acc1 + inc1, maximum1)
acc1
else
if low < maxMin1
maxMin1 := low
acc1 := math.min(acc1 + inc1, maximum1)
acc1
if na(out1)
out1 := prev1 + acc1 * (maxMin1 - prev1)
out1
if isUpTrend1
if low <= out1
isUpTrend1 := false
out1 := maxMin1
maxMin1 := low
acc1 := start1
acc1
else
if high >= out1
isUpTrend1 := true
out1 := maxMin1
maxMin1 := high
acc1 := start1
acc1
if na(out1)
if isUpTrend1
out1 := math.min(out1, bar_index == 1 ? low[1] : math.min(low[1], low[2]))
out1
else
out1 := math.max(out1, bar_index == 1 ? high[1] : math.max(high[1], high[2]))
out1
[out1, acc1, maxMin1, isUpTrend1]
start1 = input(0)
increment1 = input(0.1)
maximum1 = input(0.1)
[p1, AF1, EP1, isUpTrend1] = psar(start1, increment1, maximum1)
newEP1 = EP1 != EP1[1]
epNew1 = newEP1 ? EP1 : na
plot(p1, 'Stop', style=plot.style_line, color=isUpTrend1 ? color.rgb(0, 230, 119, 100) : color.rgb(255, 82, 82, 100), linewidth=1)
//Fast SAR
psar0(start10, inc10, maximum10) =>
out10 = float(na)
isUpTrend10 = bool(na)
maxMin10 = float(na)
acc10 = float(na)
prev10 = float(na)
if bar_index >= 1
prev10 := out10[1]
if bar_index == 1
if close > close[1]
isUpTrend10 := true
maxMin10 := math.max(high, high[1])
prev10 := math.min(low, low[1])
prev10
else
isUpTrend10 := false
maxMin10 := math.min(low, low[1])
prev10 := math.max(high, high[1])
prev10
acc10 := start10
acc10
else
isUpTrend10 := isUpTrend10[1]
acc10 := acc10[1]
maxMin10 := maxMin10[1]
maxMin10
if isUpTrend10
if high > maxMin10
maxMin10 := high
acc10 := math.min(acc10 + inc10, maximum10)
acc10
else
if low < maxMin10
maxMin10 := low
acc10 := math.min(acc10 + inc10, maximum10)
acc10
if na(out10)
out10 := prev10 + acc10 * (maxMin10 - prev10)
out10
if isUpTrend10
if low <= out10
isUpTrend10 := false
out10 := maxMin10
maxMin10 := low
acc10 := start10
acc10
else
if high >= out10
isUpTrend10 := true
out10 := maxMin10
maxMin10 := high
acc10 := start10
acc10
if na(out10)
if isUpTrend10
out10 := math.min(out10, bar_index == 1 ? low[1] : math.min(low[1], low[2]))
out10
else
out10 := math.max(out10, bar_index == 1 ? high[1] : math.max(high[1], high[2]))
out10
[out10, acc10, maxMin10, isUpTrend10]
start10 = input(0)
increment10 = input(0.01)
maximum10 = input(0.1)
[p10, AF10, EP10, isUpTrend10] = psar0(start10, increment10, maximum10)
newEP10 = EP10 != EP10[1]
epNew10 = newEP10 ? EP10 : na
plot(p10, 'Fast', style=plot.style_line, color=isUpTrend10 ? color.lime : color.red, linewidth=1)
//Slow SAR
psar1234(start12345, inc12345, maximum12345) =>
out12345 = float(na)
isUpTrend12345 = bool(na)
maxMin12345 = float(na)
acc12345 = float(na)
prev12345 = float(na)
if bar_index >= 1
prev12345 := out12345[1]
if bar_index == 1
if close > close[1]
isUpTrend12345 := true
maxMin12345 := math.max(high, high[1])
prev12345 := math.min(low, low[1])
prev12345
else
isUpTrend12345 := false
maxMin12345 := math.min(low, low[1])
prev12345 := math.max(high, high[1])
prev12345
acc12345 := start12345
acc12345
else
isUpTrend12345 := isUpTrend12345[1]
acc12345 := acc12345[1]
maxMin12345 := maxMin12345[1]
maxMin12345
if isUpTrend12345
if high > maxMin12345
maxMin12345 := high
acc12345 := math.min(acc12345 + inc12345, maximum12345)
acc12345
else
if low < maxMin12345
maxMin12345 := low
acc12345 := math.min(acc12345 + inc12345, maximum12345)
acc12345
if na(out12345)
out12345 := prev12345 + acc12345 * (maxMin12345 - prev12345)
out12345
if isUpTrend12345
if low <= out12345
isUpTrend12345 := false
out12345 := maxMin12345
maxMin12345 := low
acc12345 := start12345
acc12345
else
if high >= out12345
isUpTrend12345 := true
out12345 := maxMin12345
maxMin12345 := high
acc12345 := start12345
acc12345
if na(out12345)
if isUpTrend12345
out12345 := math.min(out12345, bar_index == 1 ? low[1] : math.min(low[1], low[2]))
out12345
else
out12345 := math.max(out12345, bar_index == 1 ? high[1] : math.max(high[1], high[2]))
out12345
[out12345, acc12345, maxMin12345, isUpTrend12345]
start12345 = input(0)
increment12345 = input(0.001)
maximum12345 = input(0.1)
[p12345, AF12345, EP12345, isUpTrend12345] = psar1234(start12345, increment12345, maximum12345)
newEP12345 = EP12345 != EP12345[1]
epNew12345 = newEP12345 ? EP12345 : na
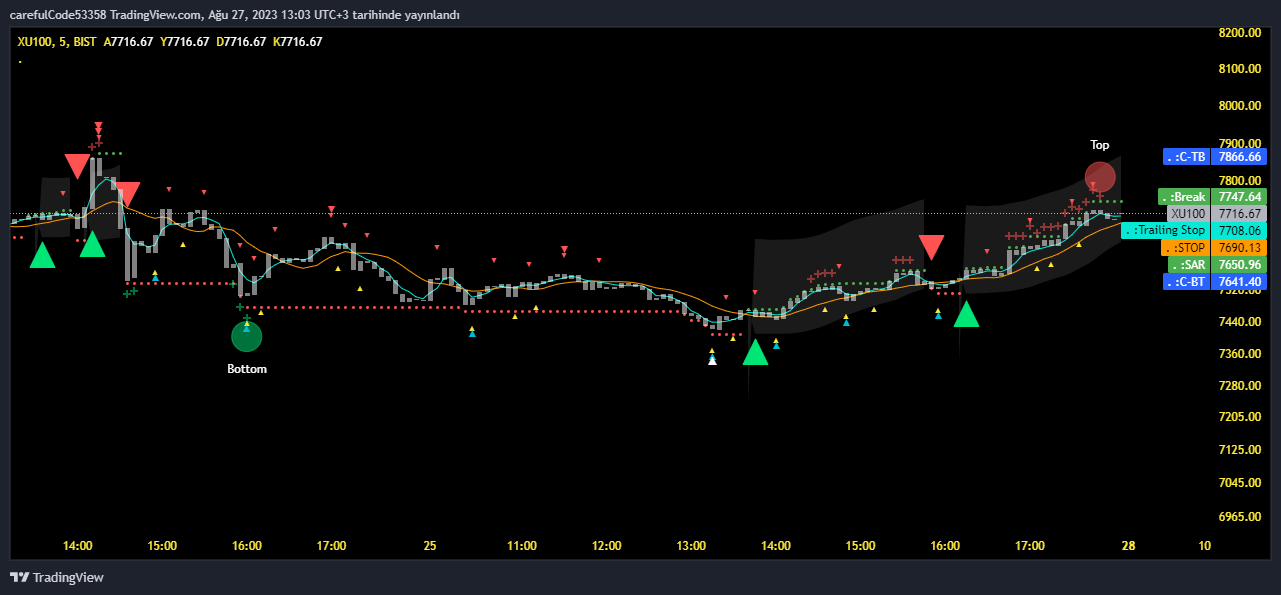
plot(p12345, 'Sar-Trend', style=plot.style_line, color=isUpTrend12345 ? color.lime : color.red, linewidth=1)
plot(EP12345, 'Sar-Break', style=plot.style_line, color=isUpTrend12345 ? color.lime : color.red, linewidth=1)
plot(epNew12345, 'Sar-Continue', style=plot.style_cross, color=isUpTrend12345 ? color.green : color.red, linewidth=2)
//Signal
xyz=ta.crossunder(epNew1,p12345)
plotshape(xyz? epNew1:na, style=shape.circle, location=location.abovebar, color=isUpTrend1 ? color.rgb(34, 247, 6) : color.rgb(247, 3, 3), size=size.normal)
xyz1=ta.crossover(epNew1,p12345)
plotshape(xyz1? epNew1:na, style=shape.circle, location=location.belowbar, color=isUpTrend1 ? color.rgb(34, 247, 6) : color.rgb(247, 3, 3), size=size.normal)
//END
//Function Sar; slow-avarage-fast
lenxc = input(5)
lenxc20 = input(5)
lenxc50 = input(5)
z(close, lenxc) =>
hxc = 0.0
dxc = 0.0
for i = 0 to lenxc - 1 by 1
kxc = (lenxc - i) * lenxc
hxc += kxc
dxc += close[i] * kxc
dxc
dxc / hxc
cxc = z(close, math.floor(math.sqrt(lenxc)))
//
z20(close, lenxc20) =>
hcx20 = 0.0
dxc20 = 0.0
for i = 0 to lenxc20 - 1 by 1
kxc20 = (lenxc20 - i) * lenxc20
hcx20 += kxc20
dxc20 += close[i] * kxc20
dxc20
dxc20 / hcx20
cxc20 = z20(close, math.floor(math.sqrt(lenxc20)))
//
z50(close, lenxc50) =>
hxc50 = 0.0
dxc50 = 0.0
for i = 0 to lenxc50 - 1 by 1
kxc50 = (lenxc50 - i) * lenxc50
hxc50 += kxc50
dxc50 += close[i] * kxc50
dxc50
dxc50 / hxc50
cxc50 = z50(close, math.floor(math.sqrt(lenxc50)))
//
//
startsx = 0.05
incrementsx = 0.75
maximumsx = 0.35
ssx = ta.sar(startsx, incrementsx, maximumsx)
s1sx = z(ssx, lenxc)
pcsx = close < s1sx ? color.rgb(255, 82, 82, 100) : color.rgb(76, 175, 79, 100)
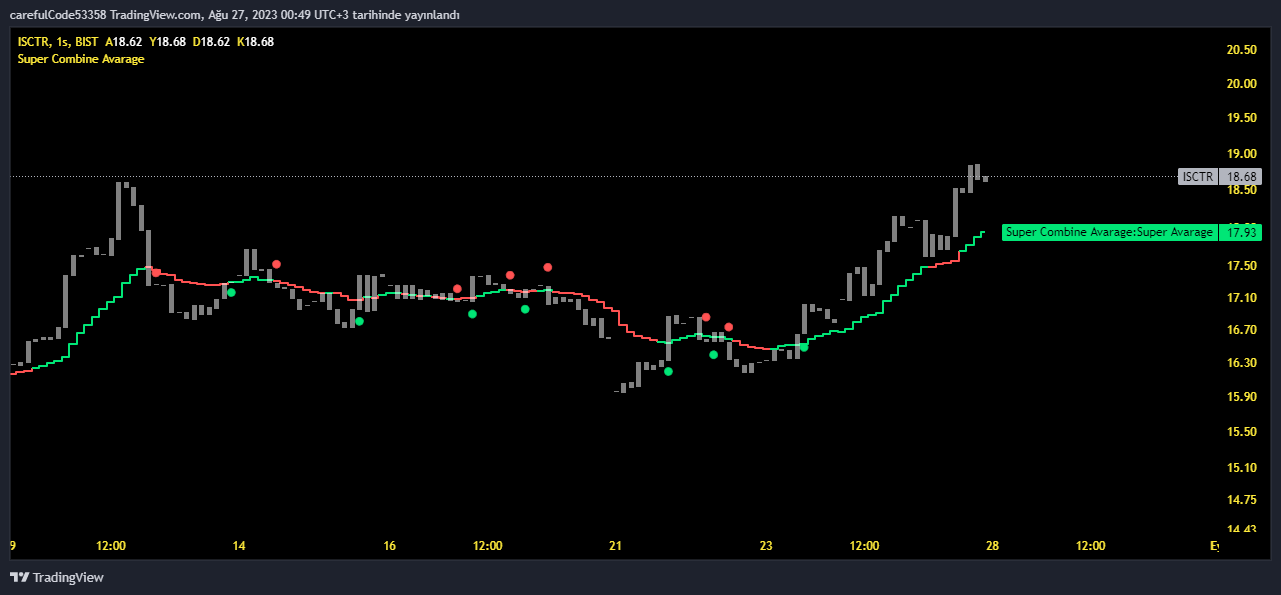
plot(s1sx, title="SAR Avarage",style=plot.style_cross, color=pcsx, linewidth=1)
startsx20 = 0.1
incrementsx20 = 0.1
maximumsx20 = 0.1
ssx20 = ta.sar(startsx20, incrementsx20, maximumsx20)
s1sx20 = z20(ssx20, lenxc20)
pcsx20 = close < s1sx20 ? color.rgb(255, 82, 82, 00) : color.rgb(76, 175, 79, 00)
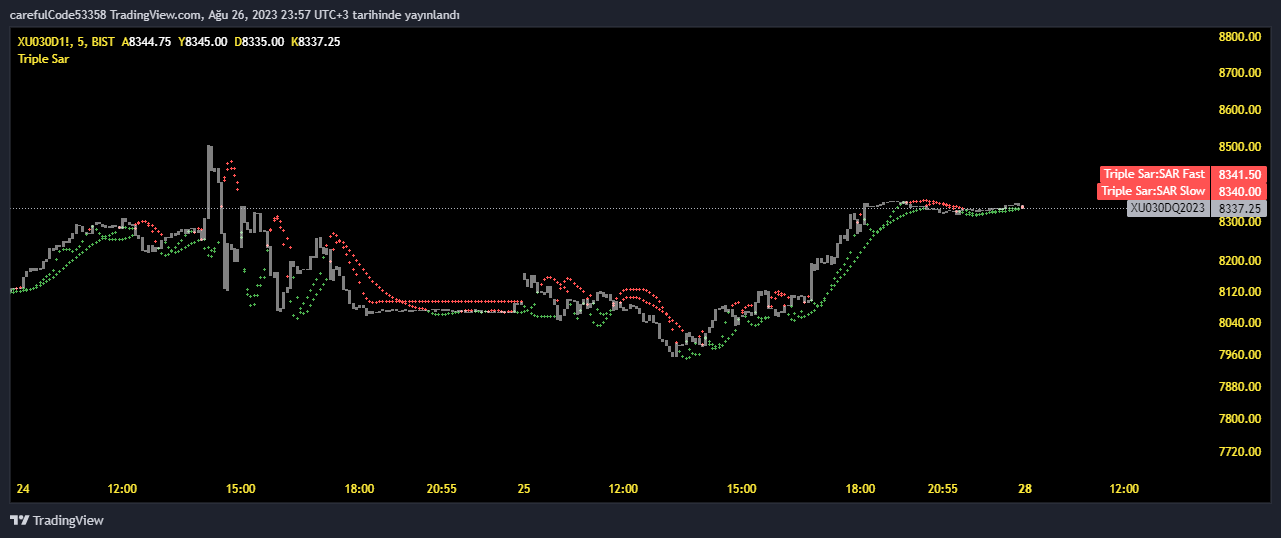
plot(s1sx20, title="SAR Slow",style=plot.style_cross, color=pcsx20, linewidth=1)
startsx50 = 0
incrementsx50 = 0.1
maximumsx50 = 1
ssx50 = ta.sar(startsx50, incrementsx50, maximumsx50)
s1sx50 = z50(ssx50, lenxc50)
pcsx50 = close < s1sx50 ? color.rgb(255, 82, 82, 00) : color.rgb(76, 175, 79, 00)
plot(s1sx50, title="SAR Fast",style=plot.style_cross, color=pcsx50, linewidth=1)
//Signal
xyzbn=ta.crossover(close,s1sx50)
plotshape(xyzbn? s1sx50:na, style=shape.circle, color=isUpTrend1 ? color.rgb(34, 247, 6) : color.rgb(247, 3, 3), size=size.small)
xyz1bn=ta.crossover(s1sx50,s1sx20)
plotshape(xyz1bn? s1sx20:na, style=shape.circle, color=isUpTrend1 ? color.rgb(34, 247, 6) : color.rgb(247, 3, 3), size=size.small)
//END
PHP Code:
//@version=5
indicator("Triple Sar", overlay = true)
//Function Sar; slow-avarage-fast
lenxc = input(5)
lenxc20 = input(5)
lenxc50 = input(5)
z(close, lenxc) =>
hxc = 0.0
dxc = 0.0
for i = 0 to lenxc - 1 by 1
kxc = (lenxc - i) * lenxc
hxc += kxc
dxc += close[i] * kxc
dxc
dxc / hxc
cxc = z(close, math.floor(math.sqrt(lenxc)))
//
z20(close, lenxc20) =>
hcx20 = 0.0
dxc20 = 0.0
for i = 0 to lenxc20 - 1 by 1
kxc20 = (lenxc20 - i) * lenxc20
hcx20 += kxc20
dxc20 += close[i] * kxc20
dxc20
dxc20 / hcx20
cxc20 = z20(close, math.floor(math.sqrt(lenxc20)))
//
z50(close, lenxc50) =>
hxc50 = 0.0
dxc50 = 0.0
for i = 0 to lenxc50 - 1 by 1
kxc50 = (lenxc50 - i) * lenxc50
hxc50 += kxc50
dxc50 += close[i] * kxc50
dxc50
dxc50 / hxc50
cxc50 = z50(close, math.floor(math.sqrt(lenxc50)))
//
//
startsx = 0.05
incrementsx = 0.75
maximumsx = 0.35
ssx = ta.sar(startsx, incrementsx, maximumsx)
s1sx = z(ssx, lenxc)
pcsx = close < s1sx ? color.rgb(255, 82, 82, 100) : color.rgb(76, 175, 79, 100)
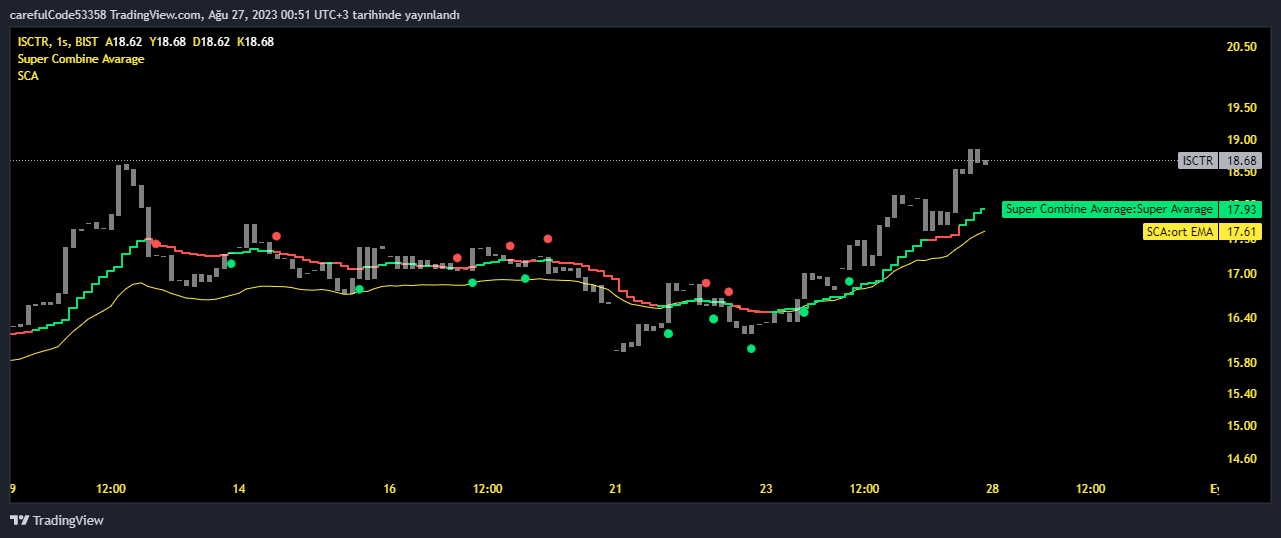
//plot(s1sx, title="SAR Avarage",style=plot.style_cross, color=pcsx, linewidth=1)
startsx20 = 0.1
incrementsx20 = 0.1
maximumsx20 = 0.1
ssx20 = ta.sar(startsx20, incrementsx20, maximumsx20)
s1sx20 = z20(ssx20, lenxc20)
pcsx20 = close < s1sx20 ? color.rgb(255, 82, 82, 00) : color.rgb(76, 175, 79, 00)
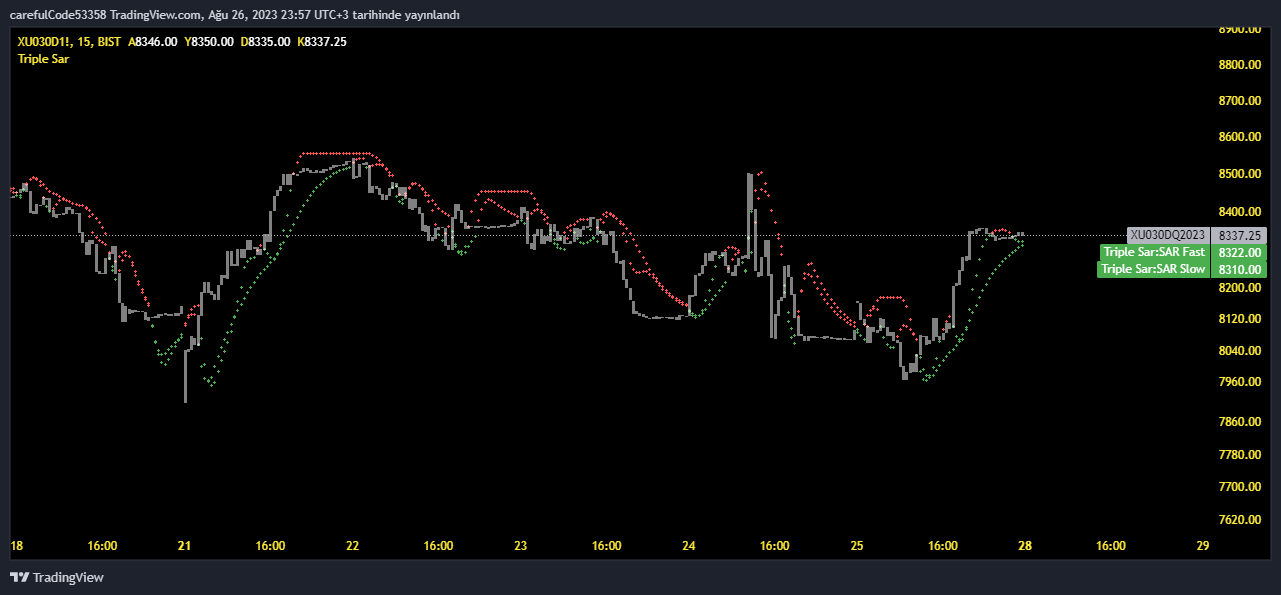
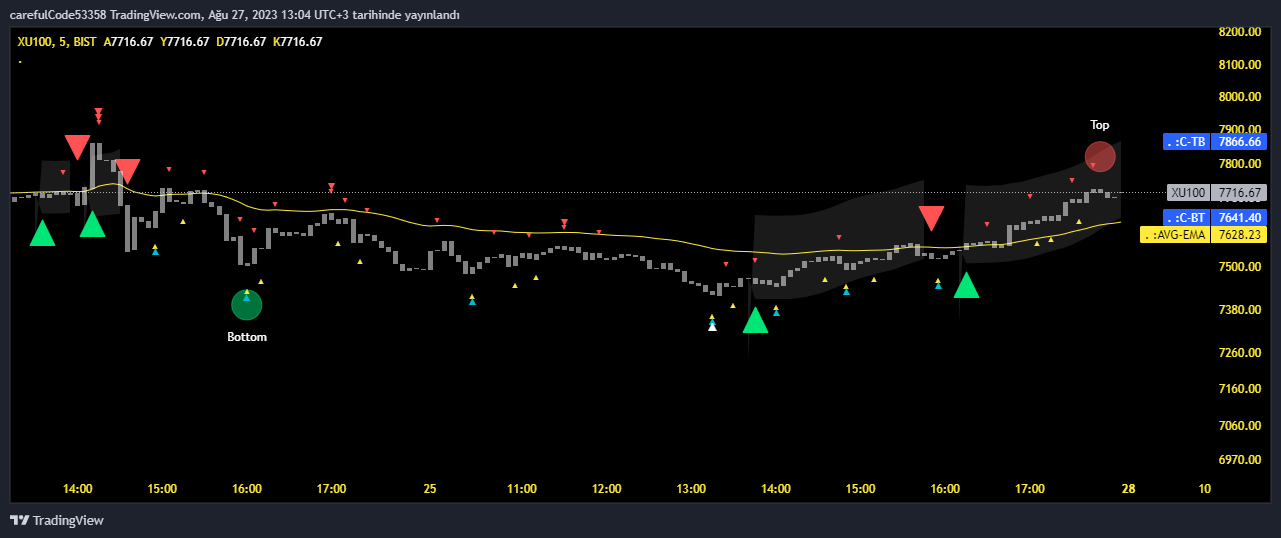
plot(s1sx20, title="SAR Slow",style=plot.style_cross, color=pcsx20, linewidth=1)
startsx50 = 0
incrementsx50 = 0.1
maximumsx50 = 1
ssx50 = ta.sar(startsx50, incrementsx50, maximumsx50)
s1sx50 = z50(ssx50, lenxc50)
pcsx50 = close < s1sx50 ? color.rgb(255, 82, 82, 00) : color.rgb(76, 175, 79, 00)
plot(s1sx50, title="SAR Fast",style=plot.style_cross, color=pcsx50, linewidth=1)
//Signal
aynı uzunluğun avarage gizlendi...fast ve slow kesişmeleri kondu....


 Alıntı yaparak yanıtla


Yer İmleri