https://tr.tradingview.com/v/NIuGTgAO/
pivota göre trend çekiyor...rakamlar küçültülebilir....

 Gümüş Üye

https://tr.tradingview.com/v/NIuGTgAO/
pivota göre trend çekiyor...rakamlar küçültülebilir....
16.07.2024 - 10.12.2024
Gümüş Üye
https://tr.tradingview.com/v/m0G2Xv7r/
otomatik mft var....
16.07.2024 - 10.12.2024
Gümüş Üye
16.07.2024 - 10.12.2024
Gümüş Üye
https://tr.tradingview.com/v/5Q0rRNo6/
çift bolinger...
16.07.2024 - 10.12.2024
Gümüş Üye
https://tr.tradingview.com/v/zvy7J87b/ bunu ana trend ve ileri projeksiyon olarak düşünün...
https://tr.tradingview.com/v/ZXIm3q7G/ bunu rsı ccı gibi....hazır strateji olarak düşünün....
https://tr.tradingview.com/v/Bcufg8oX/ bunu dip tepeler için kanal düşünün.....
https://tr.tradingview.com/v/zLGM4F2M/ bunu destek ve direnç olarak düşünün....
16.07.2024 - 10.12.2024
Gümüş Üye
bu dördünü bir sistem olarak düşünün...Originally Posted by @yörük@

kodların birleşmiş hali....
istediğiniz değişiklilrei ve ayarlamaları yapın.....PHP Code:// This work is licensed under a Attribution-NonCommercial-ShareAlike 4.0 International (CC BY-NC-SA 4.0) https://creativecommons.org/licenses/by-nc-sa/4.0/
// © LuxAlgo
//@version=5
indicator("HyperTrend [LuxAlgo]", "LuxAlgo - HyperTrend", overlay = true)
//------------------------------------------------------------------------------
//Settings
//-----------------------------------------------------------------------------{
mult = input.float(5, 'Multiplicative Factor', minval = 0)
slope = input.float(14, 'Slope', minval = 0)
width = input.float(80, 'Width %', minval = 0, maxval = 100) / 100
//Style
bullCss = input.color(color.teal, 'Average Color', inline = 'avg', group = 'Style')
bearCss = input.color(color.red, '' , inline = 'avg', group = 'Style')
area = input.string('Gradient', 'Area', options = ['Gradient', 'Solid'], group = 'Style')
upperCss = input.color(color.new(color.red, 70), 'Upper Area', group = 'Style')
lowerCss = input.color(color.new(color.teal, 70) , 'Lower Area', group = 'Style')
//-----------------------------------------------------------------------------}
//Calculation
//-----------------------------------------------------------------------------{
var float upper = na
var float lower = na
var float avg = close
var hold = 0.
var os = 1.
atr = nz(ta.atr(200)) * mult
avg := math.abs(close - avg) > atr ?
math.avg(close, avg)
: avg + os * (hold / mult / slope)
os := math.sign(avg - avg[1])
hold := os != os[1] ? atr : hold
upper := avg + width * hold
lower := avg - width * hold
//-----------------------------------------------------------------------------}
//Plots
//-----------------------------------------------------------------------------{
css = os == 1 ? bullCss : bearCss
plot_upper = plot(upper, 'Upper', na)
plot_avg = plot(avg, 'Average', os != os[1] ? na : css)
plot_lower = plot(lower, 'Lower', na)
var color upper_topcol = na
var color upper_btmcol = na
var color lower_topcol = na
var color lower_btmcol = na
//Fill
if area == 'Gradient'
upper_topcol := upperCss
upper_btmcol := color.new(chart.bg_color, 100)
lower_topcol := color.new(chart.bg_color, 100)
lower_btmcol := lowerCss
else
upper_topcol := upperCss
upper_btmcol := upperCss
lower_topcol := lowerCss
lower_btmcol := lowerCss
//Upper Area
fill(plot_upper, plot_avg
, top_color = os != os[1] ? na : upper_topcol
, bottom_color = os != os[1] ? na : upper_btmcol
, top_value = upper
, bottom_value = avg)
//Lower Area
fill(plot_avg, plot_lower
, top_color = os != os[1] ? na : lower_topcol
, bottom_color = os != os[1] ? na : lower_btmcol
, top_value = avg
, bottom_value = lower)
//-----------------------------------------------------------------------------}
//
//rodavlas12
//@version=5
// Input settings
ccimomCross = input.string('CCI', 'Entry Signal Source', options=['CCI', 'Momentum'], tooltip='CCI or Momentum will be the final source of the Entry signal if selected.')
ccimomLength = input.int(10, minval=1, title='CCI/Momentum Length')
useDivergence = input.bool(true, title='Find Regular Bullish/Bearish Divergence', tooltip='If checked, it will only consider an overbought or oversold condition that has a regular bullish or bearish divergence formed inside that level.')
rsiOverbought = input.int(65, minval=1, title='RSI Overbought Level', tooltip='Adjusting the level to extremely high may filter out some signals especially when the option to find divergence is checked.')
rsiOversold = input.int(35, minval=1, title='RSI Oversold Level', tooltip='Adjusting this level extremely low may filter out some signals especially when the option to find divergence is checked.')
rsiLength = input.int(14, minval=1, title='RSI Length')
plotMeanReversion = input.bool(false, 'Plot Mean Reversion Bands on the chart', tooltip='This function doesn\'t affect the entry of signal but it suggests buying when the price is at the lower band, and then sell it on the next bounce at the higher bands.')
emaPeriod = input(200, title='Lookback Period (EMA)')
bandMultiplier = input.float(1.8, title='Outer Bands Multiplier', tooltip='Multiplier for both upper and lower bands')
// CCI and Momentum calculation
momLength = ccimomCross == 'Momentum' ? ccimomLength : 10
mom = close - close[momLength]
cci = ta.cci(close, ccimomLength)
ccimomCrossUp = ccimomCross == 'Momentum' ? ta.cross(mom, 0) : ta.cross(cci, 0)
ccimomCrossDown = ccimomCross == 'Momentum' ? ta.cross(0, mom) : ta.cross(0, cci)
// RSI calculation
src = close
up = ta.rma(math.max(ta.change(src), 0), rsiLength)
down = ta.rma(-math.min(ta.change(src), 0), rsiLength)
rsi = down == 0 ? 100 : up == 0 ? 0 : 100 - 100 / (1 + up / down)
oversoldAgo = rsi[0] <= rsiOversold or rsi[1] <= rsiOversold or rsi[2] <= rsiOversold or rsi[3] <= rsiOversold
overboughtAgo = rsi[0] >= rsiOverbought or rsi[1] >= rsiOverbought or rsi[2] >= rsiOverbought or rsi[3] >= rsiOverbought
// Regular Divergence Conditions
bullishDivergenceCondition = rsi[0] > rsi[1] and rsi[1] < rsi[2]
bearishDivergenceCondition = rsi[0] < rsi[1] and rsi[1] > rsi[2]
// Entry Conditions
longEntryCondition = ccimomCrossUp and oversoldAgo and (not useDivergence or bullishDivergenceCondition)
shortEntryCondition = ccimomCrossDown and overboughtAgo and (not useDivergence or bearishDivergenceCondition)
// Mean Reversion Indicator
meanReversion = plotMeanReversion ? ta.ema(close, emaPeriod) : na
stdDev = plotMeanReversion ? ta.stdev(close, emaPeriod) : na
upperBand = plotMeanReversion ? meanReversion + stdDev * bandMultiplier : na
lowerBand = plotMeanReversion ? meanReversion - stdDev * bandMultiplier : na
// Plotting
plotshape(longEntryCondition, title='BUY', style=shape.triangleup, text='B', location=location.belowbar, color=color.new(color.lime, 0), textcolor=color.new(color.white, 0), size=size.tiny)
plotshape(shortEntryCondition, title='SELL', style=shape.triangledown, text='S', location=location.abovebar, color=color.new(color.red, 0), textcolor=color.new(color.white, 0), size=size.tiny)
plot(upperBand, title='Upper Band', color=color.new(color.fuchsia, 0), linewidth=1)
plot(meanReversion, title='Mean', color=color.new(color.gray, 0), linewidth=1)
plot(lowerBand, title='Lower Band', color=color.new(color.blue, 0), linewidth=1)
// Entry signal alerts
alertcondition(longEntryCondition, title='BUY Signal', message='Buy Entry Signal')
alertcondition(shortEntryCondition, title='SELL Signal', message='Sell Entry Signal')
alertcondition(longEntryCondition or shortEntryCondition, title='BUY or SELL Signal', message='Entry Signal')
////////////////////////////////////////////
// © TommasoRossini
//@version=5
lnt = input(200, "Lenght")
lnt2 = input.int(10, "Smooth", minval = 1)
lnt3 = input.float(1.00, "Zone Width", minval = 0.5, maxval = 3, step = 0.25)
downcol = input.color(#e91e63, "Premium color")
upcol = input.color(#2962ff, "Discount color")
atrs = ta.sma(ta.atr(lnt), lnt) * lnt3
max = ta.highest(high, lnt)
min = ta.lowest(low, lnt)
[middle, upper11, lower11] = ta.bb(close, lnt, 2)
upfirst = ta.sma(math.avg(max, upper11), lnt2)
downfirst = ta.sma(math.avg(min, lower11), lnt2)
upsecond = upfirst + atrs
downsecond = downfirst - atrs
average = math.avg(upfirst, downfirst, math.avg(max, min))
upavg = math.avg(average, upfirst)
downavg = math.avg(average, downfirst)
p1 = plot(upfirst, color = color.new(downcol, 100), editable = false)
p2 = plot(upsecond, color = color.new(downcol, 0), title = "Roof")
p3 = plot(downfirst, color = color.new(upcol, 100), editable = false)
p4 = plot(downsecond, color = color.new(upcol, 0), title = "Floor")
fill(p1, p2, color = color.new(downcol, 85), title = "Roof fill")
fill(p3, p4, color = color.new(upcol, 85), title = "Floor fill")
plot(close > middle ? upavg : na, color = color.new(downcol, 25), style = plot.style_linebr, title = "Second Roof")
plot(close < middle ? downavg : na, color = color.new(upcol, 25), style = plot.style_linebr, title = "Second Floor")
///////////////////////////////////////////////////////////
// This source code is subject to the terms of the Mozilla Public License 2.0 at https://mozilla.org/MPL/2.0/
// © RicardoSantos, midtownsk8rguy
// Cycle functions by: midtownsk8rguy
// https://www.tradingview.com/script/wyyXKHDn-Correlation-Cycle-CorrelationAngle-Market-State-John-Ehlers/
rad2deg(Rad) => // Radians To Degrees
var DEGREES_IN_1_RADIAN = 90.0 / math.asin(1.0) // 57.29577951308 Constant
Rad * DEGREES_IN_1_RADIAN
cc(Series, Period) => // Correlation Cycle Function
var PIx2 = 4.0 * math.asin(1.0) // 6.28318530718 Constant
period = math.max(2, Period)
Rx = 0.0
Rxx = 0.0
Rxy = 0.0
Ryy = 0.0
Ry = 0.0
Ix = 0.0
Ixx = 0.0
Ixy = 0.0
Iyy = 0.0
Iy = 0.0
for i = 1 to period by 1
iMinusOne = i - 1
X = nz(Series[iMinusOne])
temp = PIx2 * iMinusOne / period
Yc = math.cos(temp)
Ys = -math.sin(temp)
Rx += X
Ix += X
Rxx += X * X
Ixx += X * X
Rxy += X * Yc
Ixy += X * Ys
Ryy += Yc * Yc
Iyy += Ys * Ys
Ry += Yc
Iy += Ys
Iy
realPart = 0.0
temp_1 = period * Rxx - Rx * Rx
temp_2 = period * Ryy - Ry * Ry
if temp_1 > 0.0 and temp_2 > 0.0
realPart := (period * Rxy - Rx * Ry) / math.sqrt(temp_1 * temp_2)
realPart
imagPart = 0.0
temp_1 := period * Ixx - Ix * Ix
temp_2 := period * Iyy - Iy * Iy
if temp_1 > 0.0 and temp_2 > 0.0
imagPart := (period * Ixy - Ix * Iy) / math.sqrt(temp_1 * temp_2)
imagPart
[realPart, imagPart]
cap(RealPart, ImaginaryPart) => // Correlation Angle Phasor Function
var HALF_OF_PI = math.asin(1.0) // 1.57079632679 Constant
angle = ImaginaryPart == 0.0 ? 0.0 : rad2deg(math.atan(RealPart / ImaginaryPart) + HALF_OF_PI)
if ImaginaryPart > 0.0
angle -= 180.0
angle
priorAngle = nz(angle[1])
if priorAngle > angle and priorAngle - angle < 270.0
angle := priorAngle
angle
angle
//------------------------------------------------------------------------------
int length = input(20)
bool use_automatic_selection = input(false)
float cycle_length = length
if use_automatic_selection
[_real, _imag] = cc(close, length)
cycle_length := math.round(cap(_real, _imag))
cycle_length
bool is_new_cycle = false
if bar_index % cycle_length == cycle_length - 1
is_new_cycle := true
is_new_cycle
var float avg11 = open
var color pl_color = color.new(color.gray, 0)
var bool is_up = na
var line li_slope = line.new(x1=bar_index, y1=open, x2=bar_index, y2=open, xloc=xloc.bar_index, extend=extend.right, color=color.navy, style=line.style_dotted, width=1)
var line li_trend = line.new(x1=bar_index, y1=open, x2=bar_index, y2=open, xloc=xloc.bar_index, extend=extend.right, color=color.navy, style=line.style_dashed, width=1)
var float max11 = high
var float min11 = low
if high > max11
max11 := math.max(high, avg11)
max11
if low < min
min11 := math.min(low, avg11)
min11
if is_new_cycle
avg11 := (nz(avg11) * (1 + 1 / cycle_length) + close * (1 - 1 / cycle_length)) / 2
max11 := high
min11 := low
if avg11 > avg11[1]
is_up := true
pl_color := color.new(color.lime, 0)
if not is_up[1]
line.set_xy1(id=li_trend, x=line.get_x1(id=li_slope), y=avg11[1])
line.set_xy2(id=li_trend, x=bar_index[0], y=avg11)
else
line.set_xy2(id=li_trend, x=bar_index[0], y=avg11)
if avg11 < avg11[1]
is_up := false
pl_color := color.new(color.red, 0)
if is_up[1]
line.set_xy1(id=li_trend, x=line.get_x1(id=li_slope), y=avg11[1])
line.set_xy2(id=li_trend, x=bar_index[0], y=avg11)
else
line.set_xy2(id=li_trend, x=bar_index[0], y=avg11)
line.set_x1(id=li_slope, x=bar_index[1])
line.set_xy2(id=li_slope, x=bar_index[0], y=avg)
// line.new(x1=bar_index[cycle_length], y1=avg[cycle_length], x2=bar_index[0], y2=avg[0], xloc=xloc.bar_index, extend=extend.right, color=color.blue, style=line.style_dotted, width=1)
if is_up
line.set_y1(id=li_slope, y=avg - (max11 - min11) / cycle_length)
else
line.set_y1(id=li_slope, y=avg + (max11 - min11) / cycle_length)
plot(series=avg, title='avg', color=pl_color, linewidth=2, style=plot.style_stepline)
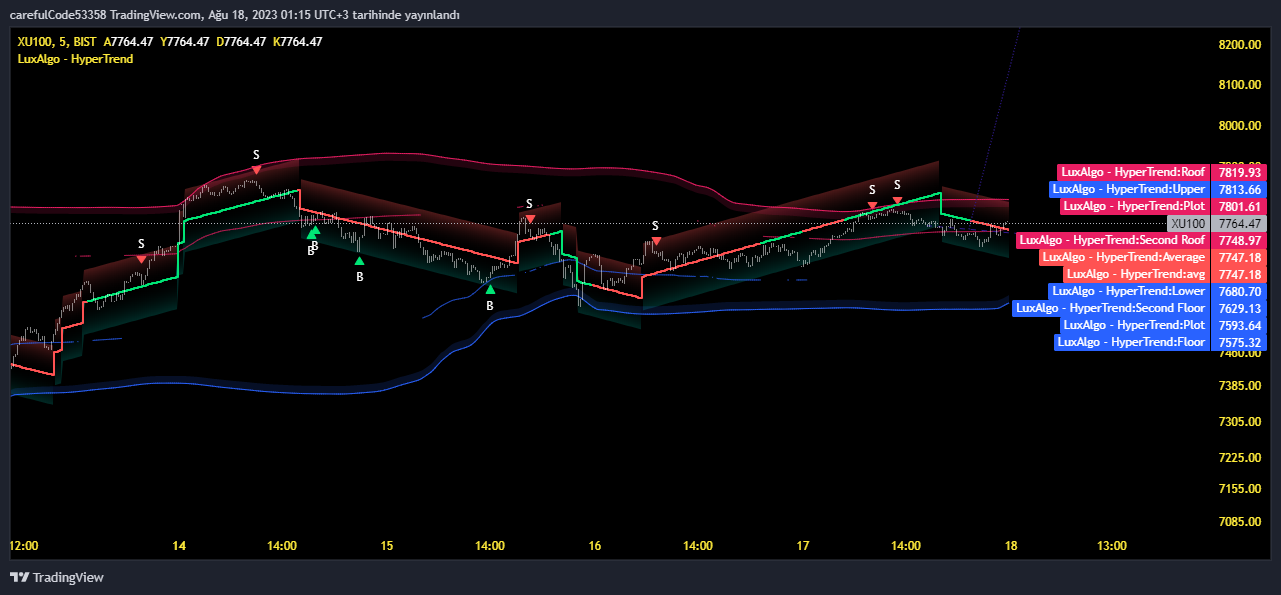
görüntü....
16.07.2024 - 10.12.2024
Gümüş Üye
https://www.tradingview.com/x/KV6UoDk1/PHP Code:// This work is licensed under a Attribution-NonCommercial-ShareAlike 4.0 International (CC BY-NC-SA 4.0) https://creativecommons.org/licenses/by-nc-sa/4.0/
// © LuxAlgo
//@version=5
indicator("*", overlay = true)
//------------------------------------------------------------------------------
//Settings
//-----------------------------------------------------------------------------{
mult = input.float(5, 'Multiplicative Factor', minval = 0)
slope = input.float(14, 'Slope', minval = 0)
width = input.float(80, 'Width %', minval = 0, maxval = 100) / 100
//Style
bullCss = input.color(color.yellow, 'Average Color', inline = 'avg', group = 'Style')
bearCss = input.color(color.aqua, '' , inline = 'avg', group = 'Style')
area = input.string('Gradient', 'Area', options = ['Gradient', 'Solid'], group = 'Style')
upperCss = input.color(color.new(color.aqua, 70), 'Upper Area', group = 'Style')
lowerCss = input.color(color.new(color.yellow, 70) , 'Lower Area', group = 'Style')
//-----------------------------------------------------------------------------}
//Calculation
//-----------------------------------------------------------------------------{
var float upper = na
var float lower = na
var float avg = close
var hold = 0.
var os = 1.
atr = nz(ta.atr(200)) * mult
avg := math.abs(close - avg) > atr ?
math.avg(close, avg)
: avg + os * (hold / mult / slope)
os := math.sign(avg - avg[1])
hold := os != os[1] ? atr : hold
upper := avg + width * hold
lower := avg - width * hold
//-----------------------------------------------------------------------------}
//Plots
//-----------------------------------------------------------------------------{
css = os == 1 ? bullCss : bearCss
plot_upper = plot(upper, 'Yüksek', na)
plot_avg = plot(avg, 'Ortalama', os != os[1] ? na : css)
plot_lower = plot(lower, 'Düşük', na)
var color upper_topcol = na
var color upper_btmcol = na
var color lower_topcol = na
var color lower_btmcol = na
//Fill
if area == 'Gradient'
upper_topcol := upperCss
upper_btmcol := color.new(chart.bg_color, 100)
lower_topcol := color.new(chart.bg_color, 100)
lower_btmcol := lowerCss
else
upper_topcol := upperCss
upper_btmcol := upperCss
lower_topcol := lowerCss
lower_btmcol := lowerCss
//Upper Area
fill(plot_upper, plot_avg
, top_color = os != os[1] ? na : upper_topcol
, bottom_color = os != os[1] ? na : upper_btmcol
, top_value = upper
, bottom_value = avg)
//Lower Area
fill(plot_avg, plot_lower
, top_color = os != os[1] ? na : lower_topcol
, bottom_color = os != os[1] ? na : lower_btmcol
, top_value = avg
, bottom_value = lower)
//-----------------------------------------------------------------------------}
//
//rodavlas12
//@version=5
// Input settings
ccimomCross = input.string('CCI', 'Entry Signal Source', options=['CCI', 'Momentum'], tooltip='CCI or Momentum will be the final source of the Entry signal if selected.')
ccimomLength = input.int(10, minval=1, title='CCI/Momentum Length')
useDivergence = input.bool(true, title='Find Regular Bullish/Bearish Divergence', tooltip='If checked, it will only consider an overbought or oversold condition that has a regular bullish or bearish divergence formed inside that level.')
rsiOverbought = input.int(65, minval=1, title='RSI Overbought Level', tooltip='Adjusting the level to extremely high may filter out some signals especially when the option to find divergence is checked.')
rsiOversold = input.int(35, minval=1, title='RSI Oversold Level', tooltip='Adjusting this level extremely low may filter out some signals especially when the option to find divergence is checked.')
rsiLength = input.int(14, minval=1, title='RSI Length')
plotMeanReversion = input.bool(false, 'Plot Mean Reversion Bands on the chart', tooltip='This function doesn\'t affect the entry of signal but it suggests buying when the price is at the lower band, and then sell it on the next bounce at the higher bands.')
emaPeriod = input(200, title='Lookback Period (EMA)')
bandMultiplier = input.float(1.8, title='Outer Bands Multiplier', tooltip='Multiplier for both upper and lower bands')
// CCI and Momentum calculation
momLength = ccimomCross == 'Momentum' ? ccimomLength : 10
mom = close - close[momLength]
cci = ta.cci(close, ccimomLength)
ccimomCrossUp = ccimomCross == 'Momentum' ? ta.cross(mom, 0) : ta.cross(cci, 0)
ccimomCrossDown = ccimomCross == 'Momentum' ? ta.cross(0, mom) : ta.cross(0, cci)
// RSI calculation
src = close
up = ta.rma(math.max(ta.change(src), 0), rsiLength)
down = ta.rma(-math.min(ta.change(src), 0), rsiLength)
rsi = down == 0 ? 100 : up == 0 ? 0 : 100 - 100 / (1 + up / down)
oversoldAgo = rsi[0] <= rsiOversold or rsi[1] <= rsiOversold or rsi[2] <= rsiOversold or rsi[3] <= rsiOversold
overboughtAgo = rsi[0] >= rsiOverbought or rsi[1] >= rsiOverbought or rsi[2] >= rsiOverbought or rsi[3] >= rsiOverbought
// Regular Divergence Conditions
bullishDivergenceCondition = rsi[0] > rsi[1] and rsi[1] < rsi[2]
bearishDivergenceCondition = rsi[0] < rsi[1] and rsi[1] > rsi[2]
// Entry Conditions
longEntryCondition = ccimomCrossUp and oversoldAgo and (not useDivergence or bullishDivergenceCondition)
shortEntryCondition = ccimomCrossDown and overboughtAgo and (not useDivergence or bearishDivergenceCondition)
// Mean Reversion Indicator
meanReversion = plotMeanReversion ? ta.ema(close, emaPeriod) : na
stdDev = plotMeanReversion ? ta.stdev(close, emaPeriod) : na
upperBand = plotMeanReversion ? meanReversion + stdDev * bandMultiplier : na
lowerBand = plotMeanReversion ? meanReversion - stdDev * bandMultiplier : na
// Plotting
plotshape(longEntryCondition, title='BUY', style=shape.triangleup, text='B', location=location.belowbar, color=color.new(color.lime, 0), textcolor=color.new(color.white, 0), size=size.tiny)
plotshape(shortEntryCondition, title='SELL', style=shape.triangledown, text='S', location=location.abovebar, color=color.new(color.red, 0), textcolor=color.new(color.white, 0), size=size.tiny)
//plot(upperBand, title='Upper Band', color=color.new(color.fuchsia, 0), linewidth=1)
//plot(meanReversion, title='Mean', color=color.new(color.gray, 0), linewidth=1)
//plot(lowerBand, title='Lower Band', color=color.new(color.blue, 0), linewidth=1)
// Entry signal alerts
//alertcondition(longEntryCondition, title='BUY Signal', message='Buy Entry Signal')
//alertcondition(shortEntryCondition, title='SELL Signal', message='Sell Entry Signal')
//alertcondition(longEntryCondition or shortEntryCondition, title='BUY or SELL Signal', message='Entry Signal')
////////////////////////////////////////////
// © TommasoRossini
//@version=5
lnt = input(200, "Lenght")
lnt2 = input.int(10, "Smooth", minval = 1)
lnt3 = input.float(1.00, "Zone Width", minval = 0.5, maxval = 3, step = 0.25)
downcol = input.color(#e91e6200, "Premium color")
upcol = input.color(#2962ff00, "Discount color")
atrs = ta.sma(ta.atr(lnt), lnt) * lnt3
max = ta.highest(high, lnt)
min = ta.lowest(low, lnt)
[middle, upper11, lower11] = ta.bb(close, lnt, 2)
upfirst = ta.sma(math.avg(max, upper11), lnt2)
downfirst = ta.sma(math.avg(min, lower11), lnt2)
upsecond = upfirst + atrs
downsecond = downfirst - atrs
average = math.avg(upfirst, downfirst, math.avg(max, min))
upavg = math.avg(average, upfirst)
downavg = math.avg(average, downfirst)
p1 = plot(upfirst, color = color.new(downcol, 100), editable = false)
p2 = plot(upsecond, color = color.new(downcol, 0), title = "Direnç")
p3 = plot(downfirst, color = color.new(upcol, 100), editable = false)
p4 = plot(downsecond, color = color.new(upcol, 0), title = "Destek")
//fill(p1, p2, color = color.new(downcol, 85), title = "Roof fill")
//fill(p3, p4, color = color.new(upcol, 85), title = "Floor fill")
plot(close > middle ? upavg : na, color = color.new(downcol, 100), style = plot.style_linebr, title = "Yukarı Kırılım")
plot(close < middle ? downavg : na, color = color.new(upcol, 100), style = plot.style_linebr, title = "Aşağı Kırılım")
///////////////////////////////////////////////////////////
// This source code is subject to the terms of the Mozilla Public License 2.0 at https://mozilla.org/MPL/2.0/
// © RicardoSantos, midtownsk8rguy
// Cycle functions by: midtownsk8rguy
// https://www.tradingview.com/script/wyyXKHDn-Correlation-Cycle-CorrelationAngle-Market-State-John-Ehlers/
rad2deg(Rad) => // Radians To Degrees
var DEGREES_IN_1_RADIAN = 90.0 / math.asin(1.0) // 57.29577951308 Constant
Rad * DEGREES_IN_1_RADIAN
cc(Series, Period) => // Correlation Cycle Function
var PIx2 = 4.0 * math.asin(1.0) // 6.28318530718 Constant
period = math.max(2, Period)
Rx = 0.0
Rxx = 0.0
Rxy = 0.0
Ryy = 0.0
Ry = 0.0
Ix = 0.0
Ixx = 0.0
Ixy = 0.0
Iyy = 0.0
Iy = 0.0
for i = 1 to period by 1
iMinusOne = i - 1
X = nz(Series[iMinusOne])
temp = PIx2 * iMinusOne / period
Yc = math.cos(temp)
Ys = -math.sin(temp)
Rx += X
Ix += X
Rxx += X * X
Ixx += X * X
Rxy += X * Yc
Ixy += X * Ys
Ryy += Yc * Yc
Iyy += Ys * Ys
Ry += Yc
Iy += Ys
Iy
realPart = 0.0
temp_1 = period * Rxx - Rx * Rx
temp_2 = period * Ryy - Ry * Ry
if temp_1 > 0.0 and temp_2 > 0.0
realPart := (period * Rxy - Rx * Ry) / math.sqrt(temp_1 * temp_2)
realPart
imagPart = 0.0
temp_1 := period * Ixx - Ix * Ix
temp_2 := period * Iyy - Iy * Iy
if temp_1 > 0.0 and temp_2 > 0.0
imagPart := (period * Ixy - Ix * Iy) / math.sqrt(temp_1 * temp_2)
imagPart
[realPart, imagPart]
cap(RealPart, ImaginaryPart) => // Correlation Angle Phasor Function
var HALF_OF_PI = math.asin(1.0) // 1.57079632679 Constant
angle = ImaginaryPart == 0.0 ? 0.0 : rad2deg(math.atan(RealPart / ImaginaryPart) + HALF_OF_PI)
if ImaginaryPart > 0.0
angle -= 180.0
angle
priorAngle = nz(angle[1])
if priorAngle > angle and priorAngle - angle < 270.0
angle := priorAngle
angle
angle
//------------------------------------------------------------------------------
int length = input(23)
bool use_automatic_selection = input(false)
float cycle_length = length
if use_automatic_selection
[_real, _imag] = cc(close, length)
cycle_length := math.round(cap(_real, _imag))
cycle_length
bool is_new_cycle = false
if bar_index % cycle_length == cycle_length - 1
is_new_cycle := true
is_new_cycle
var float avg11 = open
var color pl_color = color.new(color.gray, 0)
var bool is_up = na
var line li_slope = line.new(x1=bar_index, y1=open, x2=bar_index, y2=open, xloc=xloc.bar_index, extend=extend.right, color=color.yellow, style=line.style_dotted, width=2)
var line li_trend = line.new(x1=bar_index, y1=open, x2=bar_index, y2=open, xloc=xloc.bar_index, extend=extend.right, color=color.yellow, style=line.style_dashed, width=2)
var float max11 = high
var float min11 = low
if high > max11
max11 := math.max(high, avg11)
max11
if low < min
min11 := math.min(low, avg11)
min11
if is_new_cycle
avg11 := (nz(avg11) * (1 + 1 / cycle_length) + close * (1 - 1 / cycle_length)) / 2
max11 := high
min11 := low
if avg11 > avg11[1]
is_up := true
pl_color := color.new(color.lime, 0)
if not is_up[1]
line.set_xy1(id=li_trend, x=line.get_x1(id=li_slope), y=avg11[1])
line.set_xy2(id=li_trend, x=bar_index[0], y=avg11)
else
line.set_xy2(id=li_trend, x=bar_index[0], y=avg11)
if avg11 < avg11[1]
is_up := false
pl_color := color.new(color.red, 0)
if is_up[1]
line.set_xy1(id=li_trend, x=line.get_x1(id=li_slope), y=avg11[1])
line.set_xy2(id=li_trend, x=bar_index[0], y=avg11)
else
line.set_xy2(id=li_trend, x=bar_index[0], y=avg11)
line.set_x1(id=li_slope, x=bar_index[1])
line.set_xy2(id=li_slope, x=bar_index[0], y=avg)
// line.new(x1=bar_index[cycle_length], y1=avg[cycle_length], x2=bar_index[0], y2=avg[0], xloc=xloc.bar_index, extend=extend.right, color=color.blue, style=line.style_dotted, width=1)
if is_up
line.set_y1(id=li_slope, y=avg - (max11 - min11) / cycle_length)
else
line.set_y1(id=li_slope, y=avg + (max11 - min11) / cycle_length)
plot(series=avg, title='Trend', color=pl_color, linewidth=2, style=plot.style_stepline)
16.07.2024 - 10.12.2024
Gümüş Üye
16.07.2024 - 10.12.2024
 Gönderi Kuralları


Yer İmleri