tam buraların üstü zayıf da olsa pozitife dönüyor bende
ama aynı sinyalle bir + beş - oynayıp duruyor piyasa 10 gündür
tek bir günlük olumlu kapanış yapabildi onu da ertesi gün bozdu")

 Bronz Üye


tam buraların üstü zayıf da olsa pozitife dönüyor bende
ama aynı sinyalle bir + beş - oynayıp duruyor piyasa 10 gündür
tek bir günlük olumlu kapanış yapabildi onu da ertesi gün bozdu
Gümüş Üye

siz haklı çıktınız.....negatif momentumla...yenecek gibi şimdilik...Originally Posted by KPL

https://www.tradingview.com/x/OyhEwOrV/
16.07.2024 - 10.12.2024
Bronz Üye
ama boğa başladığında hala net SAT sinyali olmadıkça en kötü görüntüyü bile "nasıl eder de yukarı gideriz" diye okumak lazım prensip olarak, yoksa kesin düşüyor insan
Bronz Üye
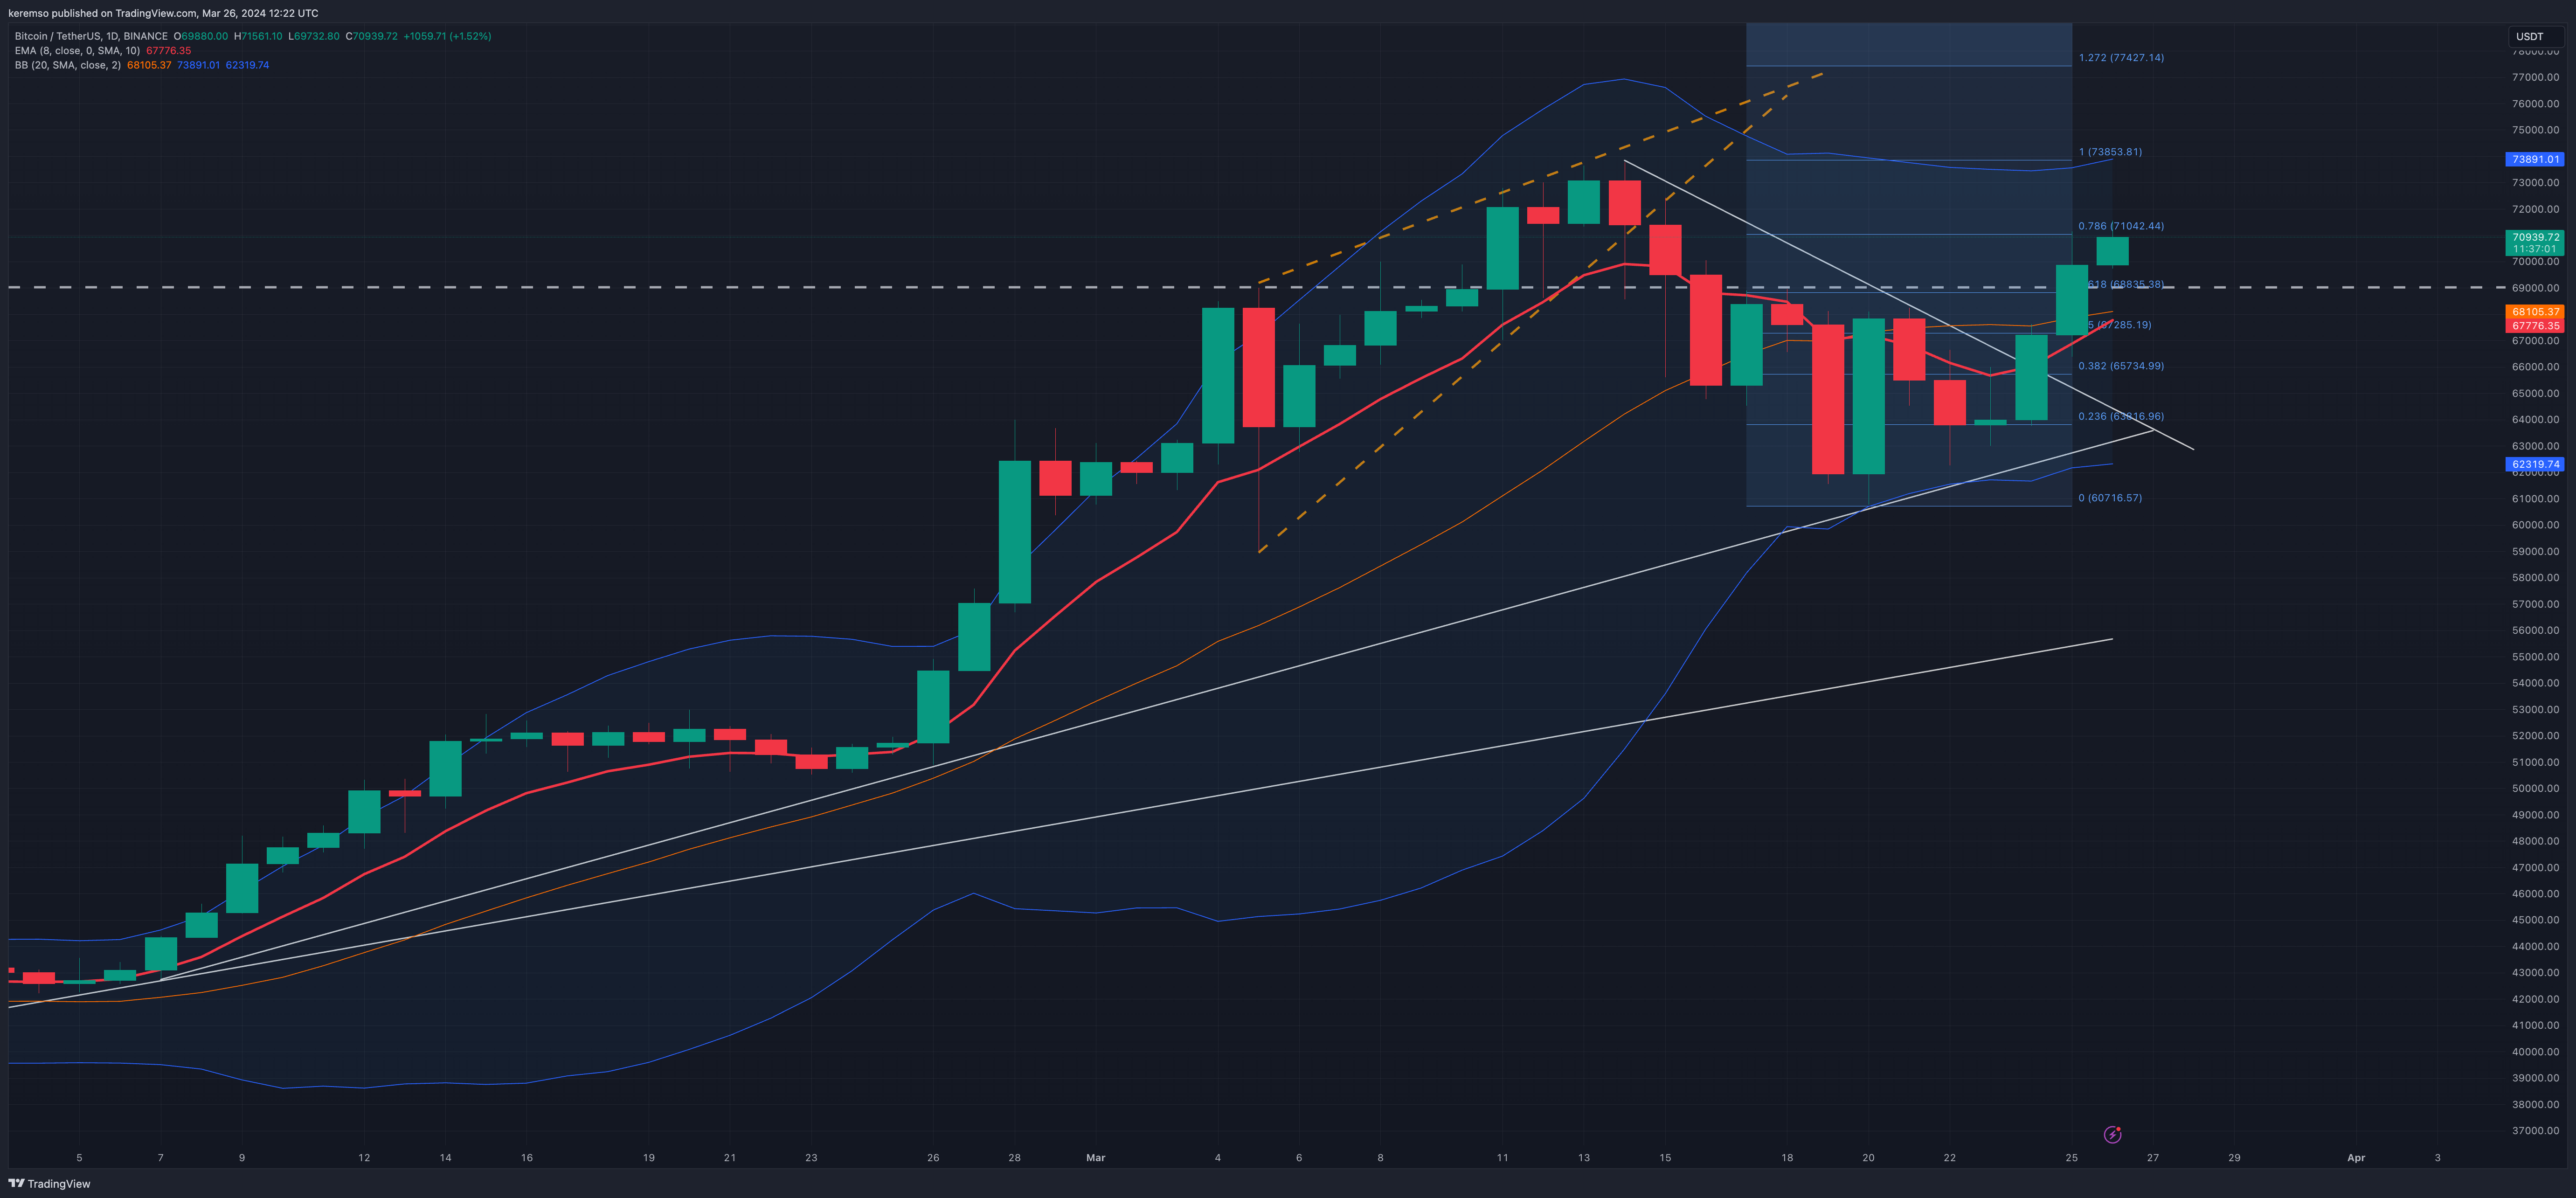
yakından, günlük
Bronz Üye
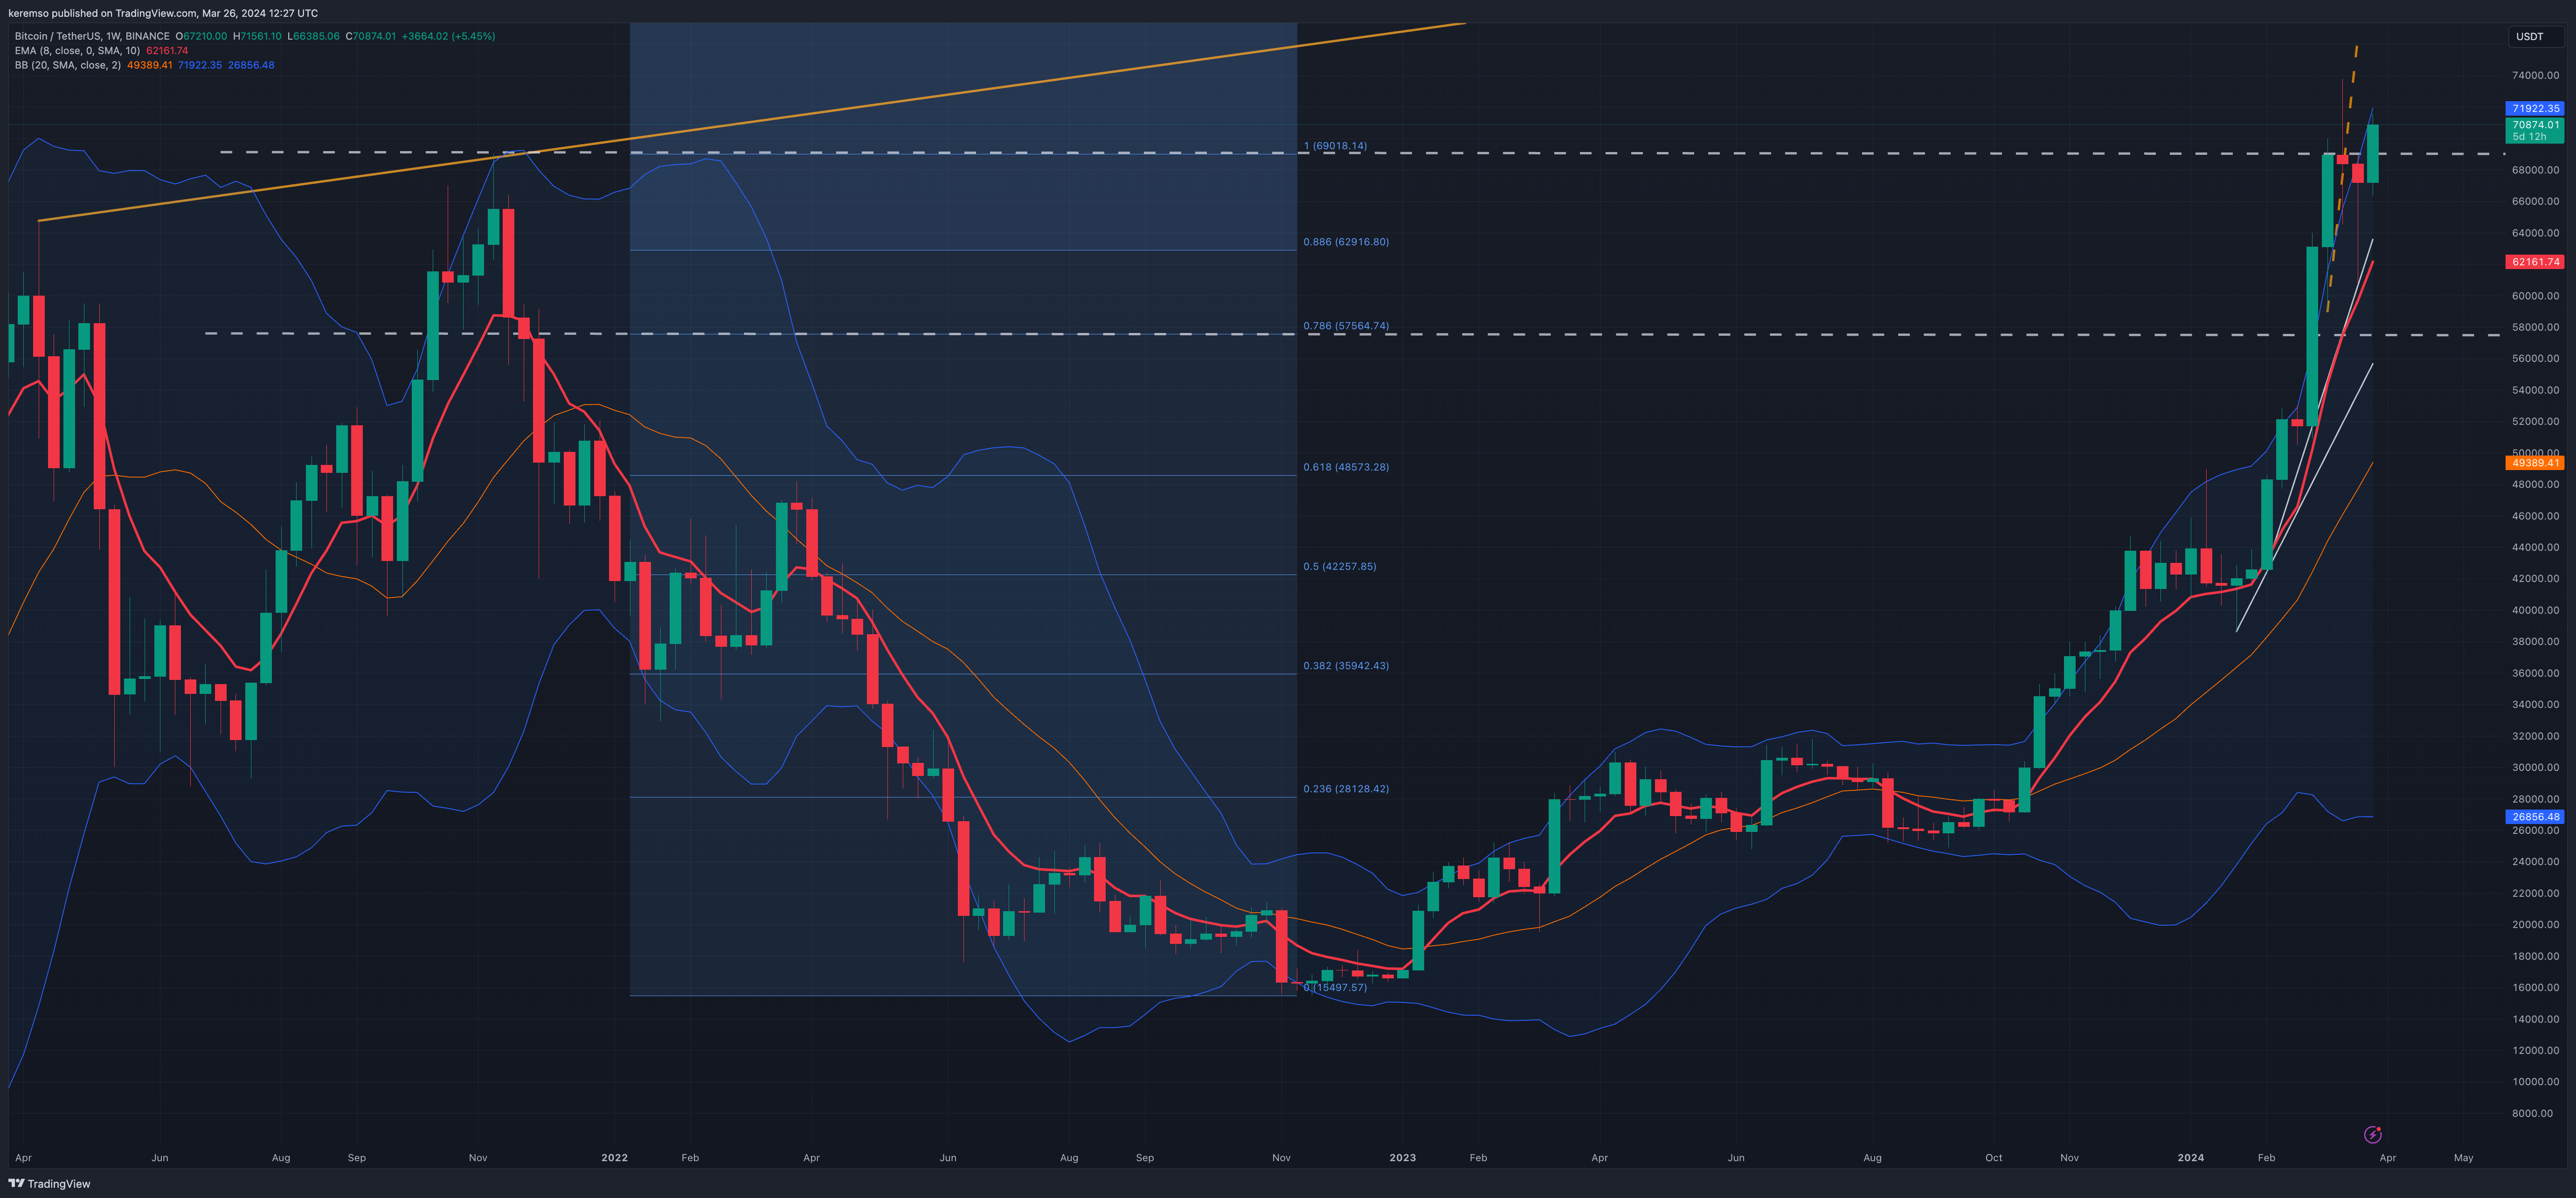
biraz daha uzaktan, haftalık
Gümüş Üye
16.07.2024 - 10.12.2024
Gümüş Üye
16.07.2024 - 10.12.2024
Bronz Üye
böyle bi yerde kim(ler) bu kadar satış giriyor bilmem ama hoş değil
fazla uzatmadan 71 üstüne atsak iyi olurdu. geç orada uzat karşim
 Gönderi Kuralları


 Alıntı yaparak yanıtla
Yer İmleri